
Research Article
Designing and Implementing an Effective Video Advertising Model on Consumer Purchase Decisions Using EEG
- Hooman Amiri *
Ongoing Doctoral Studies in Psychology, University of New Hampshire, United States America.
*Corresponding Author: Hooman Amiri, Ongoing Doctoral Studies in Psychology, University of New Hampshire, United States America.
Citation: Amiri H. (2026). Designing and Implementing an Effective Video Advertising Model on Consumer Purchase Decisions Using EEG. International Clinical Case Reports and Reviews, BioRes Scientia Publishers. 4(2):1-13. DOI: 10.59657/2993-0855.brs.26.048
Copyright: © 2026 Hooman Amiri, this is an open-access article distributed under the terms of the Creative Commons Attribution License, which permits unrestricted use, distribution, and reproduction in any medium, provided the original author and source are credited.
Received: May 29, 2026 | Accepted: June 26, 2026 | Published: August 04, 2026
Abstract
Methodology: The first stage was conducted using a descriptive-exploratory method. Based on random sampling method, 384 online questionnaires were distributed among customers for evaluation. In the second stage, a quasi-experimental research method with a pre-test-post-test design was used with one group. Ten advertisements were selected and divided into two groups: congruent and incongruent with the advertising model. Finally, the impact of advertisements on EEG waves was examined.
Purpose: The concern of commercial advertisers and providers of health and social messages is how an advertisement can influence consumer purchase decisions and behavior. The objective of this research is to design and implement an effective video advertising model on consumer purchase decisions using EEG.
Findings: The findings showed that in the first stage, the components of "after-sales services" and "price" were rejected after confirmatory factor analysis. In the second stage, EEG wave recordings indicated a significant reduction in beta wave activity in the central, frontal, and prefrontal regions after viewing advertisements congruent with the effective advertising model, while delta wave activity in the occipital region showed a significant increase. The use of elements from the research model in an advertisement increases the likelihood of capturing attention and registering in memory, leading to consumer purchase decisions.
Originality: This study provides a video advertising model considering the elements assessed in neuromarketing studies. The research reveals the effectiveness of advertisements by analyzing brain waves across various brain regions after exposure to different ad stimuli. We demonstrate that effective advertisements evoke emotional responses and reduce cognitive processing, significantly influencing consumer decisions. This study's use of EEG and analytical methods contributes to understanding the responses to advertising stimuli, providing insights into crafting more effective advertisements design strategies.
Keywords: consumer decision; electroencephalography (EEG); video advertising; effectiveness
Introduction
The concern of commercial advertisers and providers of health and social messages is how an advertisement can influence consumer decision-making and behavior within a limited time frame. To address this challenge, television advertising has been evaluated for years (Nomura & Mitsukura, 2015). For most marketing professionals, the key issue is the communication and effective reaching of customers and influencing their purchasing decisions, with advertising being the main tool for that, advertisements remain one of the key elements of any marketing campaign (Holm, 2006).
Advertisements can be categorized based on the media through which they reach the audience, including television, radio, internet, outdoor, SMS, print, and word of mouth. Among various types of advertisements, video advertisements are considered among the most popular ones. They can be broadcasted through various media channels such as television, websites, social networks, etc., and they can attract higher attention due to the presence of sound and moving images (Simmonds et al., 2020).
Traditional methods for predicting the success of video advertisements rely heavily on self-reported measures, describing the consumer's level of attention, emotions, preferences, or future purchasing behaviors related to the exposed advertisements. However, self-reporting can lead to unreliable results (Stasi et al., 2018). For example, unconscious processes occur below the threshold of awareness, and the conscious part of the human brain starts working approximately 300 to 400 milliseconds after stimulus presentation, making it unable to provide reliable verbal reports. Meanwhile, the human brain has already processed the information (Aru et al., 2012) Nevertheless, these unconscious processes may have a significant impact on consumer decision-making.
The increasing number of advertising messages and competition in the advertising field requires the search for tools that create access to customers. Advancements in cognitive neuroscience and brain functioning allow for better understanding of consumer behavior (Garcia & Saad, 2008). The use of neuroscience in marketing helps to better understand processes such as emotions, attention, memory, and decision-making, which are undoubtedly key concepts in advertising and consumer behavior (Plassmann et al., 2015). By knowing the brain's responses to different stimuli, the impact of advertising messages can be enhanced (Fugate, 2007). Accessing unconscious processes in the audience's brain during an advertisement requires tools beyond traditional methods. The use of neuroscience methods in marketing has gained widespread popularity and involves studying cortical brain activities during perception, cognition, and decision-making (Rüschendorf, 2020).
Considering that the primary objective of advertising is to change consumer attitudes and encourage them to purchase specific products or use services (purchase decisions) (Govender & Govender, 2016), developing appropriate advertising content significantly increases the likelihood of customer response and stimulates their interest. The study of advertising effectiveness, or in other words, the study of advertising content, aims to examine the effectiveness of specific advertisements. Marketing professionals need to conduct such studies both before and after the advertisements are aired (Kotler et al., 2018).
Since the decision-making process of consumers involves both cognitive and unconscious pathways (Heath, 2009), advertisements need to stimulate cognitive processing (conscious) and emotional processing (unconscious) to lead to consumer purchasing decisions (Venkatraman et al., 2012). The use of neuromarketing research in designing a model and employing neuroscience tools in implementing the designed advertising model turns this research into an interdisciplinary study. Since consumers themselves cannot provide accurate self-assessment, the use of cognitive neuroscience tools such as electroencephalography (EEG) can be decisive in assessing the effectiveness of the designed advertising model (Bercea, 2012). Considering the popularity and frequency of advertisements in the food industry, the research scope is focused on video advertisements in the food industry.
Since advertising is an inevitable aspect of marketing and considering the relatively high costs of producing advertising content and creating advertisements, as well as the extensive presence of competitors in every industry, it is essential for advertising agencies to generate attractive and memorable advertisements (Amiri, Ghorbani, & Soleimani, 2022). This requires a precise evaluation of advertisements. However, there have been very few studies on the effectiveness of advertisements and the structures of advertising campaigns. This research both presents an effective model for video advertising on consumer purchasing decisions and examines the cognitive (conscious) processing and emotional (unconscious) processing during the broadcast of video advertisements using EEG as an important neuroscience measure.
Research Framework
Considering that advertising can be regarded as an environmental stimulus and the goal of each advertisement is to convey the advertising message to the consumer's mind as a living organism, and that the consumer responds to environmental stimuli at both cognitive and unconscious levels, the following model is presented as “Proposed Effective Advertising Model on Consumer Purchase Decisions”, inspired by the Stimulus-Organism-Response (SOR) model by Russell and Mehrabian (1977) and the Sensory Marketing Model by Krishna (2012). In the stimulus section, a video advertisement is used, which has dimensions and components identified in the study by (Amiri, Ghorbani, & Soleimani, 2022), which were validated through confirmatory factor analysis in that study. The audience/consumer is considered as the recipient of the stimulus (effective advertisement) and provides a physiological response to the presented stimulus. The stimulus (advertisement) leads to changes in the brainwave patterns of the organism. These changes can be measured through the recording of EEG (Electroencephalography) waves. After inducing changes in physiological states, the organism (consumer) processes the stimulus through cognitive and emotional channels and generates a response. The type of response, based on the brainwave patterns altered in which brain region, can be investigated and examined from a neuroscientific perspective. The study proposed model is presented in Figure 1.
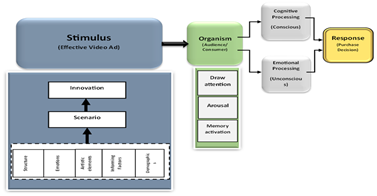
Figure 1: Proposed Effective Advertising Model on Consumer Purchase Decisions
Materials and Methods
The research was conducted in two phases. In the first phase, in terms of the implementation method, it was quantitative research with an applied and descriptive-survey approach. The statistical population of this research consisted of customers in the food industry. The questionnaire was distributed randomly among social media users through an online platform. Based on Cochran's formula, a sample size of 384 individuals was selected from an infinite population to gather data. In this study, a questionnaire tool based on our previous research was used (Amiri, Ghorbani, & Soleimani, 2022), which is presented in the initial model shown in Figure 2. Its validity was confirmed through first-order confirmatory factor analysis, and its reliability was assessed using Cronbach's alpha coefficient. The obtained alpha coefficient for the entire questionnaire was 85%, indicating acceptable reliability. The collected data were analyzed using SPSS and Amos software, employing first-order confirmatory factor analysis as the statistical method.
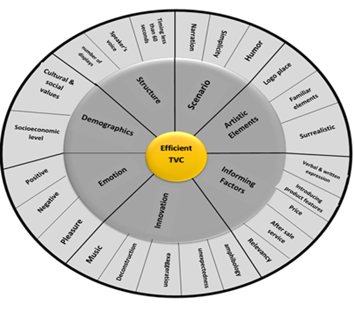
Figure 2: Efficient TVC model with neuromarketing approach (Amiri, Ghorbani, & Soleimani, 2022)
In the second phase, the research method employed was quasi-experimental with a pretest-posttest design using a single group. In order to validate the experimental procedure, participants' brain signals were recorded using a quantitative electroencephalography (QEEG) device. The main data collection tools used in this phase were a questionnaire and the QEEG device. A total of 113 video advertisements related to the food industry, considered as successful Persian advertisements between the years 2012 and 2022, were selected. All advertisements were reviewed, and 22 advertisements were separated and provided to the expert panel (Table 1). Subsequently, a questionnaire was designed to examine and determine 5 advertisements that aligned with the model (Group 1) and 5 advertisements that did not align with the model (Group 2). The questionnaire was validated through face validity and Cronbach's alpha coefficient, which yielded a Cronbach's alpha of 0.84, indicating satisfactory reliability. The questionnaire included items related to demographic characteristics, informing factors, emotions, advertising structure, innovation, scenarios, and artistic elements as the seven main dimensions of the effective advertising model. The advertisements were then shown to 15 experts in the fields of neuroscience, psychology, advertising, marketing, sales, and graphic design. After each advertisement, the participants completed a questionnaire specific to that advertisement. Statistical analysis was conducted on the questionnaire to identify the 5 advertisements that had the highest alignment with the model (Group 1) and the 5 advertisements that had the lowest alignment with the model (Group 2). The normality of the data was examined using the Kolmogorov-Smirnov test, and all variables had significance levels above 0.05, indicating a normal distribution of the variables. A total of 10 advertisements were obtained in the form of two groups (matching and non-matching with the model), and these advertisements were used for the laboratory validation of EEG signal recording for the participants. In the quantitative section related to EEG analysis, 10 advertisements were used as stimuli in the model, and 28 participants were recruited through recruitment calls. People were eligible to participate if aged between 20 to 45 with reading and writing literacy skills. The age range of 20 to 45 was chosen for the statistical population to ensure the formation and development of the prefrontal cortex and appropriate response to the emotional dimensions of the advertisements. Participants were required to have a minimum level of literacy and alertness to ensure understanding of potential metaphors used in the advertisements. The exclusion criteria were presence of chronic neurological or psychiatric diseases, visual/auditory impairments, participant's dissatisfaction or lack of cooperation during signal recording, left-handedness, male gender, and previous professional experience in the fields of graphic design, advertising, and marketing. It is worth mentioning that the individuals who participated in the EEG analysis were selected through the recruitment process. They were all right-handed females without any history of neurological, psychiatric disorders, or brain injuries, and they underwent the EEG signal recording in the laboratory of the University of Rehabilitation Sciences and Social Welfare. The demographic characteristics of the participants are presented in the table 2.
Table 1: Expert panel details
| Sl.no | Education | Expertise | Status |
| 1 | Doctorate | Marketing Management | Faculty |
| 2 | Doctorate | Marketing Management | Head of Advertising Agency Ideh |
| 3 | Doctorate | Neuroscience | Faculty |
| 4 | Doctorate | Business Administration | Advertising Manager |
| 5 | Doctorate | Psychology | Faculty |
| 6 | Master’s | Psychology | Media Analyst |
| 7 | Master’s | Marketing Management | Creativity Manager of Ideh Advertising Agency |
| 8 | Master’s | Marketing Management | Sales Manager and advertising strategist of Mihan Dairy Company |
| 9 | Master’s | Sales Management | Business and financial manager |
| 10 | Master’s | Business Administration | Advertising Manager |
| 11 | Master’s | Graphic Design | Graphic Designer |
| 12 | Master’s | Graphic Design | Graphic Designer |
| 13 | Master’s | Software | Animation Content Production Manager |
| 14 | Master’s | Human Resource Management | Sales Manager |
| 15 | Master’s | Graphic Design | Animator |
Table 2: Sociodemographic Characteristics of Participants
| Participants’ characteristic | ||
| Age | M ± SD | 28.50 ± 4.55 |
| Employment | N (%) | |
| Unemployed | 8 (28.57) | |
| Student | 15 (53.57) | |
| Employed | 5 (17.85) | |
| Highest educational level | N (%) | |
| High school | 4 (14.28) | |
| University or postgraduate degree | 24 (85.71) | |
| Marital status | N (%) | |
| Single | 23 (82.14) | |
| Married/partnered | 4 (14.28) | |
| Divorced/widowed | 1 (3.57) | |
| MMSE scores | M ± SD | 28.98 ± 1.10 |
Note. MMSE: Mini Mental state Examination
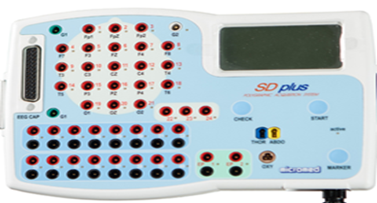
Figure 3: 29-channel quantitative electroencephalography (QEEG)
In the section dedicated to laboratory validation, participants' engagement involved the utilization of the SD PLUS 29CH device, a 29-channel quantitative electroencephalography (QEEG) apparatus produced by MICROMED, Italy. The QEEG device, along with its corresponding software, SYSTEM PLUS EVOLUTION, and NEUROGUIDE version 3.1.0, were employed for collecting and analyzing participants' physiological data. The statistical analysis of the data obtained was performed using SPSS 22 software. To capture EEG waveforms, participants were requested to sit comfortably on a chair positioned 90 centimeters away from a 21-inch display screen after providing their consent. Preceding signal acquisition, participants' scalp was properly cleaned with medical alcohol, and conductive gel was applied to ensure optimal signal quality by reducing impedance between the scalp and electrodes. Additionally, an electrode for noise reduction was connected to the right ear lobe. The EEG cap, containing a total of 19 electrodes adhering to the international 10-20 system, was then placed on participants' heads. These electrodes covered specific brain regions, including FP1, F3, C3, P3, O1, F7, T3, T5 (left hemisphere), FP2, F4, C4, P4, O2, F8, T4, T6 (right hemisphere), as well as FZ, CZ, and PZ. Each channel recorded four distinct brainwave frequencies, namely delta, theta, alpha, and beta (beta, high beta, beta1, beta2, beta3). The EEG signals were recorded both before and after participants viewed advertisements. The main objective was to assess and compare the influence of the advertisements on the average amplitude (absolute power) of brainwave activities across different brain regions before and after exposure to the advertising stimuli.

Figure 4: Placement of electrodes on participants' heads and the recording of EEG waveforms before and after watching advertisements.
The brain activity of each participant was initially recorded for two minutes while they were sitting in a relaxed state with their eyes open, looking at a bright gray screen. This stage is referred to as the baseline and serves as a reference for evaluating significant changes in brain waves after watching advertisements. Then, 10 advertisements (matched and mismatched with the model) were randomly played. After watching each advertisement for two minutes, the brain signals were recorded while the participants remained in a relaxed state, looking at an empty screen without any stimuli. The obtained data, including the baseline and brain waves after watching the 10 advertisements, were quantitatively transformed using NEUROGUIDE software. To achieve this, the recorded wave artifacts were visually judged and approximately 100 artifact-free seconds of brain waves for each stage were analyzed separately. To examine the two groups of advertisements, a one-sample t-test was employed. Then, the obtained data from the pre-test and post-test design were analyzed using paired-sample t-tests in the SPSS software. The paired-sample t-tests were conducted to compare the data before and after watching the advertisements. The comparisons were performed separately for the first and second groups.
Once the recorded brain waves were free of artifacts, they were transformed into numerical values using mathematical analyses with the help of the NEUROGUIDE software. The resulting numbers were presented in tables. For the eyes-open condition, an FFT ABSOLUTE POWER table was created, and similarly, 10 additional tables were generated for each advertisement. Each table represents the transformed numerical data obtained from 19 electrodes connected to 19 regions of the skull, as well as the four brainwave frequencies: delta, theta, alpha, and beta (beta, high-beta, beta1, beta2, beta3). To assess the conformity of response variable distributions (cognitive performance, unconscious processing, and brainwave activity) to a normal distribution, the Kolmogorov-Smirnov test was used.
Results
Prior to conducting confirmatory factor analysis, the skewness and kurtosis of the variables are examined. Before conducting any tests assuming data normality, a test for normality should be performed. In general, if the skewness and kurtosis are not within the range of (2, -2), the data does not follow a normal distribution. The data's normality has been confirmed based on the accepted levels of skewness and kurtosis, allowing us to proceed with confirmatory factor analysis using the AMOS software.
The strength of the relationships is indicated by the factor loading. Factor loadings between 0.3 and 0.6 are considered acceptable, and values greater than 0.6 are highly desirable.
To perform confirmatory factor analysis using the AMOS software, the following table was obtained, showing that the "after-sales service" and "price" components were rejected after confirmatory factor analysis.
Table 3: Results of Confirmatory Factor Analysis in AMOS
| Category | Sub-category | Factor Loading | Status |
| Demographic Features | Cultural Values | 0.65 | Confirmed |
| Socio-economic level | 0.71 | Confirmed | |
| Informing factors | Relevancy | 0.65 | Confirmed |
| Price | 0.29 | Not Confirmed | |
| Introducing product features | 0.4 | Confirmed | |
| After sales service | 0.27 | Not Confirmed | |
| Verbal and written expression | 0.73 | Confirmed | |
| Emotions | Positive | 0.61 | Confirmed |
| Negative | 0.52 | Confirmed | |
| Pleasure | 0.35 | Confirmed | |
| Ad Structure | Frequency of displays | 0.51 | Confirmed |
| Speaker’s voice | 0.56 | Confirmed | |
| Timing less than 60 seconds | 0.69 | Confirmed | |
| Innovation | Amphibology | 0.75 | Confirmed |
| Unpredictability | 0.84 | Confirmed | |
| Exaggeration | 0.7 | Confirmed | |
| Deconstruct | 0.57 | Confirmed | |
| Music | 0.55 | Confirmed | |
| Scenario | Narration | 0.32 | Confirmed |
| Simplicity | 0.83 | Confirmed | |
| Humor | 0.72 | Confirmed | |
| Artistic Elements | Surrealistic elements | 0.5 | Confirmed |
| Familiar Elements | 0.64 | Confirmed | |
| Logo Placement | 0.88 | Confirmed |
To analyze and compare the EEG data in different brain regions based on the advertisements of the first group (conforming to the model) and the second group (non-conforming to the model), we first need to ensure the normality of the data. This is a prerequisite for using the independent samples t-test. To determine the normality of the data, the Kolmogorov-Smirnov test was employed. Once the data's normality was confirmed, the independent samples t-test was conducted, using the mean values obtained, to compare the first and second groups of advertisements. According to the software output, all research variables were found to have significance levels higher than 0.05, which exceeds the threshold of 0.05. This indicates that the distributions of these variables are normal. Next, pairwise comparisons of wave activities in different brain regions were conducted between the first group (conforming to the model) and the second group (non-conforming to the model).
Table 4: Pairwise Comparisons of Five Advertisements in Group 1 and Five Advertisements in Group 2.
| Brain Waves | Significance level | T- statistic | Result | Average of 5 non-matching ads | Average of 5 Matching ads | Status |
| FP2Theta | 0.019 | 3.248 | Confirmed | 26.715 | 34.223 | Increasing |
| C3delta | 0.035 | 2.668 | Confirmed | 14.427 | 23.978 | Increasing |
| C3Hbeta | 0.038 | 2.349 | Confirmed | 14.427 | 23.978 | Increasing |
| C3beta3 | 0.048 | 2.184 | Confirmed | 2.991 | 2.454 | Decreasing |
| C4beta | 0.033 | 2.391 | Confirmed | 8.6 | 7.962 | Decreasing |
| C4Hbeta | 0.046 | 2.211 | Confirmed | 0.636 | 0.559 | Decreasing |
| C4beta3 | 0.022 | 2.603 | Confirmed | 2.583 | 2.359 | Decreasing |
| F4Hbeta | 0.019 | 2.667 | Confirmed | 0.79 | 0.695 | Decreasing |
| F4beta2 | 0.025 | 2.536 | Confirmed | 2.626 | 2.411 | Decreasing |
| F4beta3 | 0.014 | 2.833 | Confirmed | 3.153 | 2.829 | Decreasing |
| FZHbeta | 0.028 | 2.473 | Confirmed | 0.795 | 0.705 | Decreasing |
| FZbeta3 | 0.029 | 2.448 | Confirmed | 3.163 | 2.923 | Decreasing |
| O1delta | 0.008 | 3.128 | Confirmed | 12.912 | 26.495 | Increasing |
| O1Hbeta | 0.044 | 2.232 | Confirmed | 0.406 | 0.341 | Decreasing |
| P4delta | 0.03 | 2.437 | Confirmed | 34.162 | 63.929 | Increasing |
| P4Theta | 0.02 | 2.645 | Confirmed | 19.752 | 40.680 | Increasing |
| P4Alpha | 0.027 | 2.499 | Confirmed | 11.967 | 17.458 | Increasing |
| PZHbeta | 0.035 | 2.358 | Confirmed | 1.044 | 0.71 | Decreasing |
| T6beta3 | 0.032 | 2.406 | Confirmed | 3.129 | 2.493 | Decreasing |
The data presented in Table 4 compares the effects of five advertisements from Group 1 with five advertisements from Group 2 after participants viewed them. Noteworthy differences in brain wave amplitudes across various brain regions were observed between the two groups. Specifically, in the FP2 region, the amplitude of theta waves showed a significant increase after participants watched the 5 ads from Group 1 compared to Group 2 (P=0.019). Similarly, in the C3 region, the amplitude of delta waves exhibited a significant increase after viewing the 5 ads from Group 1 compared to Group 2 (P=0.035). Moreover, after watching the Group 1 ads, there was a significant increase in the amplitude of high beta waves (P=0.038) and a significant decrease in the amplitude of beta 3 waves (P=0.048) in the C3 region. In the C4 region, significant decreases were observed in the amplitudes of beta, beta 3, and high beta waves (P=0.022, P=0.046, P=0.033). The F4 region displayed significant decreases in the amplitudes of high beta, beta 2, and beta 3 waves after viewing the Group 1 ads (P=0.014, P=0.025, P=0.019). Additionally, significant decreases in the amplitudes of beta 3 and high beta waves were noted in the FZ region. In the O1 region, the amplitude of delta waves significantly increased (P=0.008), while the amplitude of high beta waves decreased significantly (P=0.044) after viewing the Group 1 ads. The P4 region showed significant increases in the amplitudes of delta, theta, and alpha waves (P=0.03, P=0.02, P=0.027). Furthermore, the PZ region exhibited a significant decrease in the amplitude of beta waves (P=0.035), and the T6 region showed a significant decrease in the amplitude of beta 3 waves (P=0.032) after participants viewed the Group 1 compared to the Group 2.
The findings from the validation of electro-encephalographic brain wave recordings suggest that beta wave activity in consumers' brains decreased significantly in central, frontal, and prefrontal regions after viewing Group 1 ads, which aligns with the effective advertising model for consumer decision-making. Additionally, delta wave activity in the parietal region increased significantly. Based on these results, it can be concluded that effective television advertisements should aim to reduce beta wave activity in the frontal, prefrontal, and central regions while increasing delta wave activity in the parietal region. This approach is believed to contribute to decreased cognitive processing activity and enhanced emotional (unconscious) processing.
Discussion
The research findings indicate that the activity of beta wave frequencies (beta 1, beta 2, beta 3, and high beta) in the brains of consumers significantly decreases in central, frontal, and prefrontal regions after viewing an effective advertisement (consistent with the research model). This suggests a reduction in cognitive processing activity and an increase in emotional (unconscious) processing through the activation of the peripheral pathway of sensory processes. These findings align with the studies conducted by (Kim et al., 2021), (Puzzo et al., 2011), (Festante et al., 2018), (Kilner et al., 2009), (Hsu & Chen, 2020), (Satapathy et al., 2019), and (Hanslmayr et al., 2011). However, they contradict the results of the research conducted by (Boksem & Smidts, 2015) and (Cho et al., 2018). Unlike the current research findings, these studies indicated that an effective advertisement should significantly increase beta wave activity for effectiveness. Based on our research and the aforementioned studies, we argue that the focus of these studies has been primarily on activating cognitive processes, whereas the advertisements used in our research predominantly stimulated emotional (unconscious) processing. Therefore, it is reasonable to explain that the unconscious stimuli used in the Group 1 advertisements (which closely align with the research model) were able to influence viewers through the reduction of beta wave activity, leading to an unconscious impact. In other words, viewers require a reduction in cognitive processing activity, particularly in the frontal and prefrontal regions, to better perceive the unconscious stimuli used in the advertisements. This occurs through the decrease in beta wave activity.
The research findings also demonstrate a significant increase in delta wave activity in the parietal region of the brain among participants after watching the Group 1 advertisements (consistent with the effective advertising model on consumer purchasing decisions). An advertisement that can activate emotional processing influences consumer purchasing decisions, referred to as emotional and unconscious decision-making. These findings align with the studies conducted by (Knyazev, 2007), (Wacker et al., 2009), (Pizzagalli et al., 2009), (Custdio, 2010), (Ohme et al., 2010), (Yokomatsu et al., 2007), and (Khushaba et al., 2012). (Khushaba et al., 2012) considered delta and theta bands to be associated with decision-making processes, which is consistent with the current research findings. (Yokomatsu et al., 2007) concluded in their studies that the increase in delta wave activity and delta oscillations during wakefulness are related to emotions and limbic regions (pleasure and reward), thus affecting the attitude and preference of the audience. The current research findings confirm these results. (Knyazev, 2007) and (Wacker et al., 2009) also argued that delta oscillations are generated by neocortical and thalamocortical networks during wakefulness and that the delta increase rhythm is a result of the detection of emotional stimuli. Since the Group 1 advertisements significantly activated emotional processing pathways, these research findings are consistent with the aforementioned studies.
The findings of the research indicate that an impactful video advertisement can create excitement and emotional stimulation in the audience. The advertisements used in this study resulted in changes in beta waves and arousal of the participants. Beta range is associated with emotional stimulation (Hajcak et al., 2010). Eliciting positive emotional states in advertisements is considered a powerful strategy to capture consumers' attention and engage them in advertising (Peters et al., 2009) and (Pieters & Warlop, 1999). Overall, emotional arousal through advertisements can be perceived as a solution to counteract the decreasing attention in advertising and serve as a tool for better communication with target consumers.
Attention is associated with electrode placements F3, C3, P3, Pz, Fz, Cz, and C4 (Agarwal & Dutta, 2015). Physiological arousal is measured as an indicator of emotional activation (attention capture) (Lajante et al., 2012). (Amiri, Ghorbani, Hassan Hosseini, et al., 2022) demonstrated through a systematic review that effective advertising is necessary to capture the audience's attention and lead to purchase decisions by activating and encoding information in memory. (Liu et al., 2012) showed that emotional arousal is related to cognitive factors such as attention and memory. Moreover, (Davidson, 1993) and (Hamann, 2001) reported a relationship between attention level and arousal in response to emotional images. They demonstrated an increase in memory encoding in response to highly arousing stimuli. The decrease in alpha wave activity observed in the aforementioned studies is equivalent to creating arousal. It is worth noting that except for advertisement number one (which was among the most effective advertisements aligned with the effective advertising model on consumer purchase decisions), a decrease in alpha wave activity was not observed in other advertisements. It should be noted that arousal can also be measured by a decrease in beta wave activity in the frontal and parietal regions (Kim et al., 2021). Additionally, (Kim et al., 2021), (Oberman et al., 2005), and (Woodruff et al., 2016) demonstrated that video clips with significant motion content induce higher levels of arousal through beta band power reduction. The findings of this research are consistent with the aforementioned studies and suggest that effective advertisements were able to generate arousal (emotional stimulation) in the audience.
The research findings have demonstrated that significant changes occurred in the frequency domain of participants' brain after viewing effective advertisements (aligned with the research model), particularly in the frontal region. This indicates that capturing attention is one of the dimensions of effective advertising on consumer purchasing decisions. These findings are consistent with the results of studies conducted by (Vecchiato et al., 2013), (Pieters & Warlop, 1999), (Diamond, 2013), (Tellis & Ambler, 2007), (Sauseng et al., 2005), and (Solomon et al., 2014).
According to the research model (Figure 1), the first group of advertisements was able to engage the attention of the recipients (organism) and evoke emotional arousal, activating their memory. Consequently, it led to the activation of cognitive processing pathways (conscious) and emotional processing (unconscious). It should be noted that the research findings indicated that effective advertisements resulted in a reduction in beta wave amplitude in central brain regions, including the frontal and prefrontal areas, as well as an increase in delta wave amplitude in the parietal region. In addition to arousing attention and activating memory, these advertisements, through reducing the level of cognitive processing performance, led to a decrease in anxiety and an enhancement of emotional processing (unconscious). This implies that the first group of advertisements, which had the highest alignment with the dimensions and components of the effective advertising model, could influence consumer purchasing decisions.
The findings show that an impactful advertisement on consumer purchase decisions activates the emotional (unconscious) processing pathway in the brain significantly more than the conscious cognitive processing pathway. Therefore, it is expected that watching impactful advertisements on consumer purchase decisions will lead to a significant decrease in the amplitude of beta waves (beta 1, beta 2, beta 3, and high beta) particularly in the central (C4), left frontal (FP1), and frontal (F7, F8, F4) regions, as well as a significant increase in the amplitude of delta waves in the parietal region (P4) of the audience/consumer's brain. The decrease in beta wave amplitude in the mentioned regions leads to a reduction in cognitive activity (conscious) and an increase in emotional processing (unconscious). The increase in delta wave amplitude is also associated with the emotional stimulation in the brain.
Based on the research findings, it is expected that effective advertisements will lead to a significant decrease in beta wave activity in the frontal and prefrontal regions, resulting in memory activation. The central (C4) and left parietal (T5) regions are also associated with memory, and a significant reduction in beta wave activity is expected in these areas after watching effective advertisements.
The findings indicate that a significant reduction in beta wave activity in the central and frontal regions, as well as the right prefrontal and frontal regions, leads to emotional stimulation and arousal in the audience. In other words, the stimuli used in effective advertisements need to induce arousal in consumers, particularly through a reduction in beta wave activity in the central regions of the brain, right prefrontal and frontal regions.
After watching the advertisements in the first group, which are considered effective advertisements that have the highest alignment with the research model, a significant decrease in beta wave activity (beta 1, beta 2, beta 3) is observed in the brain regions FP1, F4, F7, F8, C4, and T5. The reduction in beta wave activity in the central regions indicates high arousal, while the reduction in the frontal and prefrontal regions indicates activation of unconscious processing. This beta reduction may also be a reason for reducing anxiety and conscious processing. In other words, in order to activate the environmental route of perceptual processes, a decrease in conscious activity is necessary, allowing for increased unconscious processing of stimuli present in the advertisement. Overall, it can be said that after watching the advertisements in the first group, there has been an increase in emotional processing (unconscious) in the brains of the viewers, and the stimuli in the advertisements have been able to influence the purchase decisions of the viewers more unconscio-usly.
Considering that the significant decrease in beta wave activity in the FP1 region corresponds to Brodmann area 10, which is known to be related to the active visual memory. The significant decrease in beta wave activity after watching the advertisements in the first group in the F7 region, corresponding to Brodmann area 45, indicates the activation of active auditory memory and increased attention. Significant changes in beta waves in the F8 region, corresponding to Brodmann area 47, can also indicate memory activation and sustained attention. In other words, the advertisements in the first group have been able to not only capture attention but also maintain sustained attention, which increases the likelihood of registering in long-term memory and therefore affects consumer buying decisions. The significant decrease in beta wave activity in the F4 region, corresponding to Brodmann areas 8 and 9, also indicates memory activation and sustained attention. The C4 and T5 regions are also responsible for memory. It should be noted that regions like F4 are more involved in cognitive activities, and reducing beta wave activity in these regions aims to reduce cognitive processing and increase emotional processing (unconscious).
Furthermore, after watching the advertisements in the first group, there is a significant increase in delta wave activity in the P4 region. Increased delta wave activity in the parietal region is one of the signs of cognitive processing. Therefore, overall, the advertisements of the first group were able to capture attention while maintaining sustained attention and activating memory mechanisms through both cognitive and emotional processing simultaneously, influencing consumer purchase decisions. Based on the findings, it can be inferred that the share of emotional (unconscious) processing was greater than cognitive processing. The stimuli employed in the advertisements of the first group were able to unconsciously impact consumer purchase decisions. Considering that the advertisements of the first group have the highest alignment with the "effective advertising model on consumer purchase decisions," it can be concluded that incorporating the dimensions and components introduced in the model into the design and construction of an advertisement increases its influence on consumer purchase decisions.
Practical Recommendations
- Given the importance of activating emotional (unconscious) processing, it is necessary for the content of advertisements in FMCGs to lead to desirable changes in consumers' emotional responses. Considering the impact of effective advertising content on reducing the beta wave range in the frontal and prefrontal brain regions, as well as increasing the delta wave range in the occipital region, it is recommended to incorporate elements of visual and auditory pleasure in the design of advertising scenarios while adhering to the dimensions introduced in the effective advertising model on consumer purchase decisions.
- To enhance the effectiveness of advertising on consumer purchase decisions, the use of storytelling and narrative in a simple and understandable format, accompanied by humorous sentences and scenes, can amplify the impact of the scenario in an advertisement.
- It is recommended to employ stimuli such as attractive colors, relatively fast frame changes, high physical movement, appetite and pleasure-inducing visuals and sounds, as well as emotionally stimulating music and speech, to increase emotional stimulation.
- It is suggested that advertisements be presented in video format with a duration of less than 60 seconds and accompanied by a narrator's voice. Additionally, increasing the number of product/brand exposures can enhance the effectiveness of the advertisement.
- In terms of artistic elements, designing a logo and placing it in the center of the image, as well as using surrealistic imagery, can attract greater attention. Furthermore, incorporating familiar and frequently encountered everyday elements in visual design can increase the likelihood of maintaining the viewer's attention.
- The more innovative an advertisement is, the higher the likelihood of capturing the viewer's attention and registering in their memory. Utilizing different music and visuals in an exaggerated manner, as well as employing ambiguous phrases and unpredictable elements, can increase the processing time of the advertisement in the viewer's mind.
- Design the advertisement in a way that can significantly activate emotional (unconscious) processing of the viewer's brain compared to cognitive (conscious) processing. For this purpose, the stimuli used in the advertisement should lead to a decrease in beta waves, especially in the frontal brain regions, and an increase in delta wave activity, particularly in the occipital cortex.
Future Research Recommendations
Research has shown that emotional responses and decision-making vary among different age groups, as well as between men and women. Additionally, the results of studies may differ between left-handed and right-handed individuals. It is recommended to conduct the current research model on a new statistical population and investigate the impact of the mentioned factors on brainwave frequencies and purchase decisions. Since the current research focused on advertisements in the food industry, it is suggested to explore the same topic with other quantitative methods and in different industries. Other neuroscience tools such as fMRI and Eye Tracking can provide additional physiological information about viewers' brain activity during watching video advertisements, so it is proposed to execute the current research model using other neuroscience tools and compare the results with the findings of the current research.
Acknowledgment
This research received no specific grant from any funding agency in the public, commercial, or not-for-profit sectors.
References
- Agarwal, S., & Dutta, T. (2015). Neuromarketing and consumer neuroscience: current understanding and the way forward. Decision, 42(4):457-462.
Publisher | Google Scholor - Amiri, H., Ghorbani, A., Hassan Hosseini, M., & Jowkar, A. A. (2022). Identifying the effective psychologically motivational factors in neuromarketing: A systematic review. Practice in Clinical Psychology, 10(2):153-164.
Publisher | Google Scholor - Amiri, H., Ghorbani, A., & Soleimani, M. (2022). Typology of Efficient TVC Elements with Neuromarketing Approach. 3(4):106-118.
Publisher | Google Scholor - Aru, J., Bachmann, T., Singer, W., & Melloni, L. (2012). Distilling the neural correlates of consciousness. Neuroscience & Biobehavioral Reviews, 36(2):737-746.
Publisher | Google Scholor - Bercea, M. D. (2012). Anatomy of methodologies for measuring consumer behavior in neuromarketing research. Proceedings of the Lupcon Center for Business Research (LCBR) European Marketing Conference. Ebermannstadt, Germany.
Publisher | Google Scholor - Boksem, M. A., & Smidts, A. (2015). Brain responses to movie trailers predict individual preferences for movies and their population-wide commercial success. Journal of marketing research, 52(4):482-492.
Publisher | Google Scholor - Cho, P. S., Escoffier, N., Mao, Y., Ching, A., et al., (2018). Groups and emotional arousal mediate neural synchrony and perceived ritual efficacy. Frontiers in Psychology, 9, 2071.
Publisher | Google Scholor - Custdio, P. (2010). Use of EEG as a neuroscientific approach to advertising research. Nature Reviews. Neuroscience, 11(4):284-292.
Publisher | Google Scholor - Davidson, R. J. (1993). Cerebral asymmetry and emotion: Conceptual and methodological conundrums. Cognition & Emotion, 7(1):115-138.
Publisher | Google Scholor - Diamond, A. (2013). Executive functions. Annual review of psychology, 64, 135-168.
Publisher | Google Scholor - Festante, F., Vanderwert, R. E., Sclafani, V., Paukner, A., Simpson, E. A., et al., (2018). EEG beta desynchronization during hand goal-directed action observation in newborn monkeys and its relation to the emergence of hand motor skills. Developmental cognitive neuroscience, 30, 142-149.
Publisher | Google Scholor - Fugate, D. L. (2007). Neuromarketing: a layman's look at neuroscience and its potential application to marketing practice. Journal of consumer marketing.
Publisher | Google Scholor - Garcia, J. R., & Saad, G. (2008). Evolutionary neuromarketing: Darwinizing the neuroimaging paradigm for consumer behavior. Journal of Consumer Behaviour: An International Research Review, 7(4‐5):397-414.
Publisher | Google Scholor - Govender, J. P., & Govender, T. L. (2016). The influence of green marketing on consumer purchase behavior. Environmental Economics (7, Iss. 2):77-85.
Publisher | Google Scholor - Hajcak, G., MacNamara, A., & Olvet, D. M. (2010). Event-related potentials, emotion, and emotion regulation: an integrative review. Developmental neuropsychology, 35(2):129-155.
Publisher | Google Scholor - Hamann, S. (2001). Cognitive and neural mechanisms of emotional memory. Trends in cognitive sciences, 5(9):394-400.
Publisher | Google Scholor - Hanslmayr, S., Gross, J., Klimesch, W., & Shapiro, K. L. (2011). The role of alpha oscillations in temporal attention. Brain research reviews, 67(1-2):331-343.
Publisher | Google Scholor - Heath, R. (2009). Emotional engagement: How television builds big brands at low attention. Journal of advertising research, 49(1):62-73.
Publisher | Google Scholor - k Holm, O. (2006). Integrated marketing communication: from tactics to strategy. Corporate Communications: An International Journal, 11(1):23-33.
Publisher | Google Scholor - Hsu, L., & Chen, Y.-J. (2020). Neuromarketing, subliminal advertising, and hotel selection: An EEG study. Australasian Marketing Journal, 28(4):200-208.
Publisher | Google Scholor - Khushaba, R. N., Greenacre, L., Kodagoda, S., Louviere, J., et al., (2012). Choice modeling and the brain: A study on the Electroencephalogram (EEG) of preferences. Expert Systems with Applications, 39(16):12378-12388.
Publisher | Google Scholor - k Kilner, J. M., Neal, A., Weiskopf, N., Friston, et al., (2009). Evidence of mirror neurons in human inferior frontal gyrus. Journal of Neuroscience, 29(32):10153-10159.
Publisher | Google Scholor - Kim, H., Seo, P., Choi, J. W., & Kim, K. H. (2021). Emotional arousal due to video stimuli reduces local and inter-regional synchronization of oscillatory cortical activities in alpha-and beta-bands. Plos one, 16(7):e0255032.
Publisher | Google Scholor - k k Knyazev, G. G. (2007). Motivation, emotion, and their inhibitory control mirrored in brain oscillations. Neuroscience & Biobehavioral Reviews, 31(3):377-395.
Publisher | Google Scholor - k Kotler, P., Keller, K. L., Ang, S. H., Tan, C. T., et al., (2018). Marketing management: an Asian perspective. Pearson London.
Publisher | Google Scholor - Lajante, M., Droulers, O., Dondaine, T., & Amarantini, D. (2012). Opening the black box of electrodermal activity in consumer neuroscience research. Journal of Neuroscience, Psychology, and Economics, 5(4):238.
Publisher | Google Scholor - Liu, Y., Huang, H., McGinnis-Deweese, M., Keil, A., & Ding, M. (2012). Neural substrate of the late positive potential in emotional processing. Journal of Neuroscience, 32(42):14563-14572.
Publisher | Google Scholor - Nomura, T., & Mitsukura, Y. (2015). EEG-based detection of TV commercials effects. Procedia Computer Science, 60, 131-140.
Publisher | Google Scholor - Oberman, L. M., Hubbard, E. M., McCleery, J. P., Altschuler, E. L., Ramachandran, et al., (2005). EEG evidence for mirror neuron dysfunction in autism spectrum disorders. Cognitive brain research, 24(2):190-198.
Publisher | Google Scholor - Ohme, R., Reykowska, D., Wiener, D., & Choromanska, A. (2010). Application of frontal EEG asymmetry to advertising research. Journal of economic psychology, 31(5):785-793.
Publisher | Google Scholor - Peters, C., Asteriadis, S., & Rebolledo-Mendez, G. (2009). Modelling user attention for human-agent interaction. 2009 10th workshop on image analysis for multimedia interactive services.
Publisher | Google Scholor - Pieters, R., & Warlop, L. (1999). Visual attention during brand choice: The impact of time pressure and task motivation. International Journal of research in Marketing, 16(1):1-16.
Publisher | Google Scholor - k Pizzagalli, D. A., Holmes, A. J., Dillon, D. G., Goetz, E. L., Birk, J. L., et al., (2009). Reduced caudate and nucleus accumbens response to rewards in unmedicated individuals with major depressive disorder. American Journal of Psychiatry, 166(6):702-710.
Publisher | Google Scholor - Plassmann, H., Venkatraman, V., Huettel, S., & Yoon, C. (2015). Consumer neuroscience: applications, challenges, and possible solutions. Journal of marketing research, 52(4):427-435.
Publisher | Google Scholor - Puzzo, I., Cooper, N. R., Cantarella, S., & Russo, R. (2011). Measuring the effects of manipulating stimulus presentation time on sensorimotor alpha and low beta reactivity during hand movement observation. NeuroImage, 57(4):1358-1363.
Publisher | Google Scholor - Rüschendorf, J. (2020). Neuromarketing: Insights into the consumer brain and its adaption to brand management.
Publisher | Google Scholor - Satapathy, S. K., Dehuri, S., Jagadev, A. K., & Mishra, S. (2019). EEG Brain Signal Classification for Epileptic Seizure Disorder Detection. Academic Press.
Publisher | Google Scholor - Sauseng, P., Klimesch, W., Doppelmayr, M., Pecherstorfer, T., Freunberger, R., et al., (2005). EEG alpha synchronization and functional coupling during top‐down processing in a working memory task. Human brain mapping, 26(2):148-155.
Publisher | Google Scholor - Simmonds, L., Bellman, S., Kennedy, R., Nenycz-Thiel, M., & Bogomolova, S. (2020). Moderating effects of prior brand usage on visual attention to video advertising and recall: An eye-tracking investigation. Journal of Business Research, 111:241-248.
Publisher | Google Scholor - Solomon, M. R., Dahl, D. W., White, K., Zaichkowsky, J. L., & Polegato, R. (2014). Consumer behavior: Buying, having, and being (Vol. 10). Engelwood Cliffs: Prentice Hall.
Publisher | Google Scholor - Stasi, A., Songa, G., Mauri, M., Ciceri, A., Diotallevi, F., et al., (2018). Neuromarketing empirical approaches and food choice: A systematic review. Food Research International, 108, 650-664.
Publisher | Google Scholor - k Tellis, G. J., & Ambler, T. (2007). The SAGE handbook of advertising. Sage.
Publisher | Google Scholor - Vecchiato, G., Cherubino, P., Trettel, A., & Babiloni, F. (2013). Neuroelectrical brain imaging tools for the study of the efficacy of TV advertising stimuli and their application to neuromarketing. Springer.
Publisher | Google Scholor - Venkatraman, V., Clithero, J. A., Fitzsimons, G. J., & Huettel, S. A. (2012). New scanner data for brand marketers: How neuroscience can help better understand differences in brand preferences. Journal of consumer psychology, 22(1):143-153.
Publisher | Google Scholor - k Wacker, J., Dillon, D. G., & Pizzagalli, D. A. (2009). The role of the nucleus accumbens and rostral anterior cingulate cortex in anhedonia: integration of resting EEG, fMRI, and volumetric techniques. NeuroImage, 46(1):327-337.
Publisher | Google Scholor - Woodruff, C. C., Barbera, D., & Von Oepen, R. (2016). Task-related dissociation of EEG β enhancement and suppression. International Journal of Psychophysiology, 99, 18-23.
Publisher | Google Scholor - Yokomatsu, E., Ito, S.-i., Mitsukura, Y., Cao, J., & Fukumi, M. (2007). A design of the preference acquisition detection system. SICE Annual Conference 2007.
Publisher | Google Scholor