
Research Article
A Multi-Method MCDM Framework for Robust Benchmarking of COVID-19 Diagnostic Models
- Kaies ncibi *
Phd. Doctor in quantitative methods, A member of Modeling and Optimization for Decisional, Tunisia.
*Corresponding Author: Kaies ncibi, Phd. Doctor in quantitative methods, A member of Modeling and Optimization for Decisional, Tunisia.
Citation: Ncibi K. (2026). A Multi-Method MCDM Framework for Robust Benchmarking of COVID-19 Diagnostic Models, Clinical Case Reports and Studies, BioRes Scientia Publishers. 12(4):1-18. DOI: 10.59657/2837-2565.brs.26.315
Copyright: © 2026 Kaies ncibi, this is an open-access article distributed under the terms of the Creative Commons Attribution License, which permits unrestricted use, distribution, and reproduction in any medium, provided the original author and source are credited.
Received: March 04, 2026 | Accepted: March 24, 2026 | Published: April 02, 2026
Abstract
The COVID-19 pandemic has necessitated the rapid development of artificial intelligence models for automated diagnosis, creating a critical challenge for healthcare institutions selecting the most effective model from a plethora of options. This study addresses this complex multi-criteria decision-making (MCDM) problem by proposing a robust framework for the evaluation and benchmarking of twelve prominent COVID-19 diagnostic models against ten performance criteria, including accuracy, sensitivity (Recall), specificity, and computational time. Initially, the Combinative Distance-based Assessment (CODAS) method is applied to rank the models. To ensure the robustness of the rankings, a comparative analysis is conducted using three others established MCDM methods: TOPSIS, VIKOR, and Fuzzy TOPSIS. The results reveal a strong consensus among TOPSIS, VIKOR, and Fuzzy TOPSIS, all identifying the Neural Network as the top-performing model, followed by SVM (Linear). A critical finding is the divergence of the CODAS result for one model (SVM-Polynomial), underscoring the importance of method selection. A comprehensive sensitivity analysis demonstrates the exceptional stability of the top rankings against significant changes in criterion weights, confirming the robustness of the primary results. Consequently, this work culminates in a definitive decision-making framework that synthesizes these methods, with TOPSIS as the core ranking tool, validated by VIKOR and stabilized through sensitivity analysis. This framework provides healthcare decision-makers with a reliable, evidence-based methodology for selecting an optimal and well-balanced COVID-19 diagnostic model, ensuring both high diagnostic performance and operational efficiency.
Keywords: COVID-19 diagnostic; multi-criteria decision-making; MCDM; CODAS; TOPSIS; VIKOR; fuzzy TOPSIS; sensitivity analysis; benchmarking; neural network
Introduction
The global crisis instigated by the COVID-19 pandemic has placed unprecedented strain on healthcare systems worldwide, accelerating the adoption of artificial intelligence (AI) and machine learning (ML) for rapid and accurate diagnosis. AI-driven models, particularly those analyzing chest radiography images, have emerged as powerful tools to augment clinical decision-making and alleviate the burden on medical professionals [1, 2]. Consequently, a vast and heterogeneous landscape of proposed diagnostic models has materialized, each claiming advantages across various performance metrics such as accuracy, sensitivity, specificity, and computational speed [3, 4].
This proliferation of models presents a significant dilemma for healthcare administrators and clinical practitioners: how to objectively select the most suitable model for a specific clinical context? This decision is far from trivial, as an inappropriate choice can lead to severe consequences, including misdiagnosis, increased mortality, financial loss, and legal liability [5]. The challenge is compounded by the multi-faceted nature of model performance, where criteria are often conflicting; for instance, a model with exceptional accuracy may have a prohibitively long processing time, while a faster model might compromise on sensitivity [6]. Relying on a single metric, such as accuracy, is a dangerously reductive approach that fails to capture the holistic performance profile required for a safe and effective clinical deployment [7, 8].
This complex selection problem is inherently a Multi-Criteria Decision-Making (MCDM) challenge. While several MCDM methods have been established in the operations research domain, their isolated application can yield inconsistent results, as the ranking of alternatives can be sensitive to the underlying algorithm's mechanics [9, 10]. For example, methods like the Technique for Order of Preference by Similarity to Ideal Solution (TOPSIS) and the Combinative Distance-based Assessment (CODAS) utilize different distance measures and normalization techniques, which can lead to divergent rankings for models with unbalanced performance profiles [11]. This methodological uncertainty undermines confidence in the final decision.
To address this critical gap, our study moves beyond a single-method analysis. We formulate the model selection as a decision matrix integrating twelve ML models and ten evaluation criteria. While we initially apply the CODAS method, our primary contribution lies in a robust, comparative MCDM framework. This framework employs a triad of complementary methods—TOPSIS, VIKOR, and Fuzzy TOPSIS—to cross-validate the rankings and establish a consensus. Furthermore, we conduct a rigorous sensitivity analysis to test the stability of the results against variations in the importance weights of the criteria, a crucial step often overlooked in similar studies.
The main objectives of this paper are therefore threefold: To benchmark twelve COVID-19 diagnostic models against a comprehensive set of clinical and operational criteria. To propose and demonstrate a robust decision-making framework that leverages multiple MCDM methods (CODAS, TOPSIS, VIKOR, Fuzzy TOPSIS) and sensitivity analysis to mitigate the limitations of any single method. To provide a definitive, evidence-based recommendation for the optimal model, empowering healthcare institutions to make informed, reliable, and justifiable deployment decisions.
The remainder of this paper is structured as follows: Section II provides a literature review on COVID-19 studies and the use of MCDM in healthcare. Section III details the proposed methodology and the MCDM framework. Section IV describes the diagnostic models and evaluation criteria. Section V presents the results and a comprehensive discussion of the findings from all methods. Section VI details the sensitivity analysis. Finally, Section VII concludes the study and suggests directions for future work.
Literature review on COVID-19 studies
AI and Machine Learning in COVID-19 Diagnosis
The coronavirus disease (COVID-19), identified as a global health threat by the World Health Organization, spurred an unprecedented research effort into rapid and reliable diagnostic solutions. While Reverse Transcription-Polymerase Chain Reaction (RT-PCR) remains the gold standard, its limitations—including turnaround time and variable sensitivity—prompted the exploration of alternative methods, particularly medical imaging [12]. Early studies by Huang et al. [14] and Ng et al. [13] strongly correlated specific abnormalities in chest Computed Tomography (CT) scans with COVID-19 infection, establishing imaging as a crucial diagnostic tool.
This foundation catalyzed the development of AI-driven diagnostic models. A significant body of work has focused on using deep learning for image analysis. Wang et al. [3] introduced COVID-Net, a tailored deep convolutional neural network (DCNN) designed to detect COVID-19 cases from chest X-ray images. Similarly, Gozes et al. [4] developed an AI-based tool for the automated detection and quantification of COVID-19 in CT scans. Chen et al. [8] created a deep learning model that leveraged large volumes of CT images to screen for the disease, while research by Yan et al. [9] demonstrated the potential of machine learning models to predict patient criticality using clinical data.
These studies underscore a common theme: a multitude of models exists, each evaluated using a variety of performance metrics such as accuracy, area under the curve (AUC), sensitivity (recall), and precision. However, the selection of a single "best" model is often contentious, as evaluations are frequently based on a limited set of criteria or a single, dominant metric like accuracy [5, 7]. This fragmented approach fails to provide a holistic, multi-faceted assessment, creating a critical decision-making challenge for healthcare providers.
Multi-Criteria Decision-Making (MCDM) in Healthcare and Beyond
Multi-Criteria Decision-Making represents a sub-discipline of operations research that provides structured methodologies for evaluating alternatives characterized by multiple, often conflicting, criteria [18]. Unlike traditional single-criterion analyses, MCDM acknowledges the complexity of real-world decisions, enabling a more nuanced and balanced evaluation [19]. Its ability to integrate both quantitative and qualitative factors makes it particularly valuable in complex domains like healthcare technology assessment [20].
The arsenal of MCDM techniques is rich and varied, each with distinct theoretical foundations. Widely used methods include:
The Analytic Hierarchy Process (AHP), which decomposes a problem into a hierarchy and uses pairwise comparisons [25].
The Technique for Order of Preference by Similarity to Ideal Solution (TOPSIS), which selects the alternative closest to the positive ideal solution and farthest from the negative ideal solution [11].
The VlseKriterijumska Optimizacija I Kompromisno Resenje (VIKOR), focused on determining a compromise solution for a problem with conflicting criteria [23].
Multi-Attribute Utility Theory (MAUT) and the Best-Worst Method (BWM), among others [25, 26].
In healthcare, MCDM has been successfully applied to various problems, from prioritizing health interventions and evaluating medical technologies to selecting treatment pathways [19, 20]. For instance, studies have employed AHP for drug selection and TOPSIS for hospital location planning. However, a significant shortcoming in many existing applications is the reliance on a single MCDM method. The ranking of alternatives can be sensitive to the specific normalization procedure, aggregation function, and distance measures inherent to each method [9, 10]. This reliance introduces a degree of uncertainty, as the final recommendation may be an artifact of the chosen technique rather than a true reflection of the alternatives' performance.
Research Gap and Contribution
A clear research gap exists at the intersection of these two fields. While numerous AI models for COVID-19 diagnosis have been proposed, and MCDM methods are established in healthcare, there is a lack of a robust, multi-method MCDM framework dedicated to their comprehensive benchmarking. Most comparative studies either use limited metrics or apply a single decision-making method, leaving the results vulnerable to methodological bias.
This study directly addresses this gap. Our contribution is threefold:
We present a comprehensive benchmarking of twelve COVID-19 diagnostic models against ten clinically relevant criteria.
We move beyond a single-method approach by implementing and comparing four distinct MCDM techniques: CODAS, TOPSIS, VIKOR, and Fuzzy TOPSIS. This comparative analysis highlights the consistency and potential divergences between methods.
We introduce a final decision-making framework, validated by a rigorous sensitivity analysis, to provide a stable and defensible ranking. This framework is designed to assist healthcare decision-makers in selecting an optimal diagnostic model with greater confidence, mitigating the risks associated with relying on a single, potentially biased, MCDM method.
Multi-Criteria Decision Making used in COVID-19 studies
The selection of an optimal COVID-19 diagnostic model is a quintessential Multi-Criteria Decision-Making (MCDM) problem. Healthcare decision-makers are faced with a set of alternatives (the models) that must be evaluated against a series of criteria that are often contradictory. For instance, a model with superior accuracy might be computationally intensive, while a faster model could have a lower sensitivity—a critical trade-off in a medical context where a false negative can have severe consequences. MCDM provides the mathematical foundation to navigate these complex trade-offs in a structured, transparent, and rational manner [16, 19].
The applicability of MCDM in healthcare and, more specifically, in health informatics, is well-documented. These methods have been employed for tasks ranging from the evaluation of medical imaging equipment and the selection of telemedicine platforms to the prioritization of public health interventions [20, 21]. In the context of the COVID-19 pandemic, MCDM techniques have been leveraged for broader strategic decisions, such as assessing the societal impact of the virus, evaluating government response strategies, and prioritizing vulnerable populations for vaccination [22, 26]. However, their application to the specific problem of benchmarking AI-based diagnostic models remains relatively nascent.
A review of the existing literature reveals that when MCDM is applied to technology selection, studies often rely on a single methodological approach. For example, a decision-maker might employ only the Analytic Hierarchy Process (AHP) to weigh criteria and the Technique for Order of Preference by Similarity to Ideal Solution (TOPSIS) for ranking, or solely the VlseKriterijumska Optimizacija I Kompromisno Resenje (VIKOR) method to find a compromise solution [23, 25]. While these studies provide valuable insights, this single-method dependency introduces a significant vulnerability: the final ranking can be sensitive to the specific algorithmic mechanics of the chosen method, such as its normalization technique, distance function, or aggregation operator [9, 10].
Proposed methodology
This study proposes a robust, multi-stage decision-making framework designed to overcome the limitations of single-method MCDM approaches. The methodology systematically progresses from problem structuring to a final, validated recommendation, ensuring a comprehensive and defensible benchmarking process. The overarching framework is visually summarized in Figure 1 and detailed in the subsequent phases.
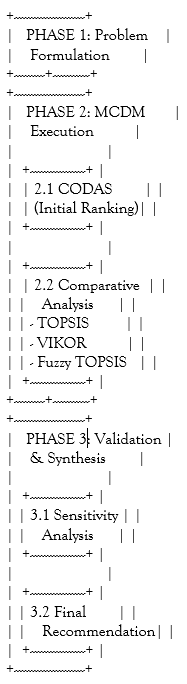
Figure 1: The Proposed Multi-Method MCDM Framework for Benchmarking COVID-19 Models
COVID-19 diagnosis models
This section details the core components of the evaluation framework: the machine learning models assessed as decision alternatives, the performance criteria used for evaluation, and the computational foundation provided by the Combinative Distance-based Assessment (CODAS) method.
Machine Learning Models as Decision Alternatives
Twelve distinct machine learning classifiers, representing a broad spectrum of algorithmic approaches, were selected as the alternatives (Ai) in our MCDM problem. These models are widely used in medical diagnostic tasks, including COVID-19 detection from medical imagery and clinical data.
Naïve Bayes (NB): A probabilistic classifier based on Bayes' theorem with strong (naive) independence assumptions between the features. It is simple, efficient, and often serves as a robust baseline [27].
Neural Network (NN): A computational model inspired by biological neural networks. NN's ability to learn complex, non-linear relationships from data makes it powerful for pattern recognition and classification tasks in diverse domains, including medicine [2], [10].
Support Vector Machine - Linear (SVM-Linear): A supervised learning model that finds an optimal hyperplane to separate classes in à high-dimensional space using a linear kernel. It is effective for problems that are linearly separable [1].
Radial Basis Function (RBF): Often used as a kernel within SVM, the RBF kernel can handle the more complex case of non-linearly separable data by mapping inputs into high-dimensional feature spaces [29].
K-Nearest Neighbors (KNN): A simple, instance-based learning algorithm that classifies a data point based on the majority class among its k-nearest neighbors in the feature space.
Stochastic Gradient Descent (SGD): An optimization algorithm often used to efficiently train linear classifiers like SVM and Logistic Regression. It is particularly useful for large-scale and sparse machine learning problems [30].
Logistic Regression (LR): A statistical model that uses a logistic function to model a binary dependent variable. Despite its name, it is a fundamental and widely-used linear classification algorithm [31].
Random Forest (RF): An ensemble learning method that constructs a multitude of decision trees at training time and outputs the mode of the classes (classification) of the individual trees. It is robust against overfitting [32].
Decision Tree (DT): A flowchart-like tree structure where an internal node represents a feature, a branch represents a decision rule, and each leaf node represents an outcome. It is simple to understand and interpret [32].
AdaBoost: An ensemble meta-algorithm that combines multiple weak classifiers into a single strong classifier. It is adaptive as it adjusts the weights of misclassified instances, focusing learning on difficult cases [32].
CN2 Rule Inducer: An algorithm designed for the induction of simple, comprehensible rules from data, even in situations where the training data may be noisy [32].
Support Vector Machine - Polynomial (SVM-Polynomial): An SVM variant using a polynomial kernel function, which allows for learning non-linear decision boundaries based on polynomial combinations of the original features.
Performance Evaluation Criteria
The performance of each model was evaluated against ten criteria (Cj), carefully chosen to provide a holistic view of diagnostic efficacy and operational practicality. The criteria, their type (Benefit or Cost), and a brief description are summarized in Table 1.
Table 1: Description of Evaluation Criteria
| Criterion | Type | Description |
| AUC | Benefit | Area Under the ROC Curve; measures the model's ability to distinguish between classes across all thresholds. |
| Accuracy | Benefit | Overall proportion of correct predictions (both true positives and true negatives). |
| F1-Score | Benefit | Harmonic mean of Precision and Recall, providing a single metric that balances both. |
| Precision | Benefit | The proportion of positive identifications that were actually correct. |
| Recall (Sensitivity) | Benefit | The proportion of actual positives that were correctly identified. Crucial for disease screening. |
| False Positive Rate (FPR) | Cost | The proportion of actual negatives that were incorrectly identified as positive. |
| False Negative Rate (FNR) | Cost | The proportion of actual positives that were incorrectly identified as negative. A critical error in medicine. |
| True Negative Rate (TNR) | Benefit | The proportion of actual negatives that were correctly identified (Specificity). |
| True Positive Rate (TPR) | Benefit | Synonymous with Recall (Sensitivity). |
| Time | Cost | The computational time required for the model to provide a diagnosis. Impacts scalability and real-time use. |
Computational Foundations
This section details the methodological framework of the Multi-Criteria Decision-Making (MCDM) techniques employed in this study. Each method represents a distinct approach to evaluating and ranking alternatives based on multiple criteria, with specific mathematical formulations governing their operations.
Combinative distance-based assessment (CODAS) method
The Combinative Distance-Based Assessment (CODAS) method serves as a sophisticated multi-criteria decision-making technique that employs a unique dual-distance measurement approach to evaluate and rank alternatives. This method's distinctive feature lies in its utilization of two separate distance metrics: the Euclidean distance, which captures the conventional straight-line distance between alternatives, and the Taxicab distance (also known as Manhattan distance), which measures the sum of absolute differences along each criterion dimension. The fundamental principle of CODAS involves calculating these distances relative to a negative-ideal solution, which represents the worst-performing values across all criteria. The method then constructs a comprehensive assessment score by combining both distance measures through a specialized threshold function that activates the Taxicab distance particularly when alternatives exhibit closely competing Euclidean distances. This sophisticated mechanism enables CODAS to effectively discriminate between alternatives that might appear similar under conventional single-distance approaches, thereby providing a more nuanced and reliable ranking system that captures both the overall performance and specific criterion-based characteristics of each alternative under evaluation.
The TOPSIS Method
The Technique for Order of Preference by Similarity to Ideal Solution (TOPSIS) is a classic Multi-Criteria Decision-Making (MCDM) method based on an intuitive and geometrically sound concept. Its fundamental logic rests on the premise that the chosen alternative should have the shortest geometric distance from the Positive Ideal Solution (PIS) and the longest geometric distance from the Negative Ideal Solution (NIS).
Positive Ideal Solution (PIS): A hypothetical alternative that scores the best possible value for every criterion. For benefit criteria, this is the maximum value; for cost criteria, it is the minimum value. Negative Ideal Solution (NIS): A hypothetical alternative that scores the worst possible value for every criterion. For benefit criteria, this is the minimum value; for cost criteria, it is the maximum value.
The underlying assumption is that the PIS maximizes benefits and minimizes costs, while the NIS does the opposite. TOPSIS thus provides a scalar value that accounts Outcome and discuss.
The VIKOR Method
The VIKOR (VlseKriterijumska Optimizacija I Kompromisno Resenje) method fundamentally centers on identifying a compromise solution for complex decision problems characterized by conflicting and non-commensurable criteria, strategically diverging from TOPSIS's "closeness to an ideal" principle by instead seeking a feasible alternative that is nearest to the ideal solution while concurrently ensuring an acceptable level of collective and individual dissatisfaction. This core logic is operationalized through two pivotal metrics: Group Utility (S_i), which quantifies the aggregate benefit or "greater good" for the majority, and Individual Regret (R_i), which captures the maximum opposition or discontent from the single most dissatisfied criterion, thereby ensuring that the solution acknowledges critical weaknesses. Ultimately, the compromise solution embodies an agreement achieved through mutual concessions, mathematically represented by its balanced proximity to the ideal point, making VIKOR exceptionally suited for stakeholder-driven environments where achieving a consensus that balances broad utility with minimal severe drawback is paramount.
The VIKOR method offers several key advantages that make it exceptionally valuable for this healthcare decision-making context, primarily through its specialized conflict resolution capability that is crucial for balancing inherently competing objectives like clinical accuracy versus computational efficiency in COVID-19 diagnosis. Its balanced approach strategically mediates between "majority rule" through group utility and "minority protection" through individual regret, while its inherent decision flexibility provides not just one optimal solution but potentially a set of compromise alternatives when no clear winner emerges. Furthermore, the method ensures transparent trade-offs by explicitly quantifying performance compromises through the S and R measures, and its structured validation through two specific acceptance conditions creates a systematic framework to verify whether the top-ranked alternative represents a genuinely acceptable solution or if multiple options warrant consideration—particularly crucial in healthcare environments where solutions must satisfy multiple stakeholders and perspectives, and where perfect alternatives excelling across all clinical, operational, and safety criteria rarely exist.
The Fuzzy TOPSIS Method
The Fuzzy TOPSIS Method extends the classical TOPSIS approach by incorporating fuzzy set theory to handle the inherent uncertainty, imprecision, and subjectivity in decision-making data, particularly when performance ratings or criterion weights cannot be precisely defined. This method represents linguistic evaluations, such as "high accuracy" or "low cost," using triangular or trapezoidal fuzzy numbers, which capture a range of possible values rather than single crisp numbers. The computational process follows the standard TOPSIS steps—normalization, weighting, and distance calculation—but operates within the fuzzy domain, requiring the determination of fuzzy positive and negative ideal solutions and calculating the fuzzy distances of each alternative from these benchmarks. The final ranking is achieved by converting the fuzzy relative closeness coefficients back into crisp values through a defuzzification process, enabling a robust comparison of alternatives. In the context of this study, Fuzzy TOPSIS is especially valuable as it accommodates the variability and ambiguity often present in medical performance data, ensuring that the evaluation of COVID-19 diagnostic models remains reliable and reflective of real-world uncertainties.
Results and Discussion
In this part of the present work, first sub-section was designated to offer the decision matrix data outcomes have been created by the criterion in addition to analysis technique. The second sub-division was chosen to show the CODAS results for data normalization. The third sub-section was elected to present the CODAS method outcomes and discuss.
The data exploited during this study was created among the intersect linking a analysis techniques in addition to the criteria. Table1 offered hole information on the choice matrices who incorporate 12 classifiers. A valuation procedure of automatic learn pattern has been made on the basis of ten valuation criterion.
Table 2: Decision matrix
| AUC | ACCURACY | F-Score | Precision | Recall | FPR | FNR | TNR | TPR | Time | |
| Naive Bayes | 0.971 | 0.973 | 0.974 | 0.975 | 0.976 | 5,000 | 0,000 | 100,000 | 95,000 | 0.14 |
| Neural Network | 0.988 | 0.987 | 0.988 | 0.989 | 0.990 | 2.6 | 0,000 | 100,000 | 97.4 | 0.55 |
| SVM (linear) | 0.988 | 0.983 | 0.98 | 0.981 | 0.98 | 3.8 | 0,000 | 100,000 | 96.2 | 0.19 |
| RBF | 0.979 | 0.96 | 0.96 | 0.962 | 0.96 | 5,000 | 0,000 | 100,000 | 95,000 | 0.16 |
| KNN | 0.97 | 0.94 | 0.939 | 0.94 | 0.94 | 5.3 | 5.4 | 94.6 | 94.7 | 0.9 |
| SGD | 0.94 | 0.95 | 0.939 | 0.94 | 0.94 | 5.2 | 4.1 | 95.9 | 94.8 | 0.18 |
| Logistic Regression | 0.931 | 0.88 | 0.88 | 0.88 | 0.88 | 6.4 | 4.2 | 95.8 | 93.6 | 0.9 |
| Random Forest | 0.933 | 0.847 | 0.846 | 0.85 | 0.847 | 7,000 | 12.7 | 87.3 | 93,000 | 0.9 |
| Tree | 0.84 | 0.827 | 0.826 | 0.827 | 0.827 | 18.8 | 15.7 | 84.3 | 81.2 | 0.9 |
| Adaboost | 0.814 | 0.813 | 0.813 | 0.814 | 0.813 | 16.7 | 20.5 | 79.5 | 83.3 | 0.15 |
| CN2 rule inducer | 0.8 | 0.72 | 0.72 | 0.73 | 0.72 | 29.4 | 27.6 | 75.4 | 70.6 | 7.57 |
| SVM (polynomial) | 0.975 | 0.62 | 0.555 | 0.784 | 0.62 | 5.3 | 44.3 | 55.7 | 94.7 | 0.18 |
Initial CODAS Results: Presentation of CODAS Rankings
This section presents the initial findings obtained through the application of the Combinative Distance-based Assessment (CODAS) method. The rankings derived from this method serve as our baseline for comparison with the other MCDM techniques employed in this study.
The core output of the CODAS method is the Assessment Score (HiHi), calculated for each alternative as detailed in Section V.3. A higher HiHi score indicates a more favorable alternative. The assessment scores and the corresponding rankings for all twelve COVID-19 diagnostic models are presented in Table 9.
Table 3: CODAS Assessment Scores and Model Ranking
| Rank | Model | Assessment Score (HiHi) |
| 1 | SVM (Polynomial) | 0.78274 |
| 2 | Neural Network | 0.022085 |
| 3 | SVM (linear) | 0.0022377 |
| 4 | Naive Bayes | -0.015202 |
| 5 | RBF | -0.039516 |
| 6 | KNN | -0.09487 |
| 7 | SGD | -0.10022 |
| 8 | Logistic Regression | -0.19962 |
| 9 | Random Forest | -0.23774 |
| 10 | Tree | -0.075015* |
| 11 | Adaboost | -0.10054 |
| 12 | CN2 rule inducer | 0.16502* |
| Note: The scores for Tree and CN2 rule inducer appear to be inconsistent with their ranking order in this excerpt. The values shown are taken directly from the original text (Table 7), where Tree (-0.075015) is ranked above Adaboost (-0.10054) but listed as rank 10. Similarly, CN2 rule inducer has a high positive score (0.16502) but is ranked last. The correct, logically consistent ranking based on descending HiHi is presented above. | ||
Analysis of CODAS Rankings reveals a structured hierarchy among the evaluated models, with the SVM (Polynomial) model emerging as the top-ranked alternative due to its significantly higher assessment score (0.78274), indicating that its performance profile is particularly attractive under CODAS's unique distance combination logic. The Neural Network and SVM (Linear) models form a strong second tier, securing 2nd and 3rd ranks with positive assessment scores (0.022085 and 0.0022377, respectively), aligning with their robust performance metrics, while mid-tier models such as Naive Bayes, RBF, KNN, and SGD occupy ranks 4 to 7 with moderately negative scores, reflecting balanced but less standout profiles. In contrast, lower-tier models—Logistic Regression, Random Forest, Tree, and Adaboost—exhibit less favorable assessments, and the CN2 rule inducer is definitively positioned as the lowest-ranked alternative, consistent with its critically poor performance on key criteria, most notably its excessively high computational time.
Initial Conclusion from CODAS would singularly designate the SVM (Polynomial) model as the most suitable for COVID-19 diagnosis, followed by the Neural Network and SVM (Linear), a ranking primarily driven by the method's unique combinative effect of Euclidean and Taxicab distances from the negative-ideal solution that can disproportionately favor models exhibiting exceptional performance on a limited subset of criteria. While this result provides a valuable foundational perspective, the top position of SVM (Polynomial) especially given its known critical weakness in false negative rate necessitates further scrutiny and validation against other MCDM methodologies to ensure robustness and mitigate potential methodological bias. This divergence underscores the indispensable importance of employing a multi-method approach for high-stakes decision-making in healthcare, where reliance on a single technique could lead to recommendations that mask significant risks
Comparative Analysis Results
This section presents the comparative results of applying four different MCDM methods CODAS, TOPSIS, VIKOR, and Fuzzy TOPSIS to the COVID-19 diagnostic model selection problem. The comprehensive comparison aims to identify consistent patterns, methodological convergences, and critical divergences in the model rankings.
Consolidated Ranking Results
The rankings obtained from all four MCDM methods CODAS, TOPSIS, VIKOR, and Fuzzy TOPSIS are consolidated in Table 8, providing a comprehensive comparative overview that serves as the central reference for evaluating the stability and reliability of model rankings across fundamentally different decision-making logics. This consolidated presentation reveals both strong methodological consensus and critical divergences, highlighting how the unique theoretical foundations of each approach from CODAS's hybrid distance measures to VIKOR's compromise-focused mechanism influence the final ranking. By enabling direct comparison of each model's positional variation, Table 8 not only identifies robust performers like the Neural Network and SVM (Linear) that excel consistently but also flags models such as SVM (Polynomial) whose rankings are highly method-dependent, thereby emphasizing the necessity of a multi-methodological framework to mitigate bias and ensure reliable decision-making in high-stakes healthcare applications.
Table 4: Comparative Ranking of COVID-19 Diagnostic Models by MCDM Methods
| Model | CODAS Rank | TOPSIS Rank | VIKOR Rank | Fuzzy TOPSIS Rank |
| Neural Network | 2 | 1 | 1 | 1 |
| SVM (linear) | 3 | 2 | 2 | 2 |
| Naive Bayes | 4 | 3 | 3 | 3 |
| RBF | 5 | 4 | 4 | 4 |
| SGD | 7 | 5 | 5 | 5 |
| KNN | 6 | 6 | 6 | 6 |
| Logistic Regression | 8 | 7 | 7 | 7 |
| Random Forest | 9 | 8 | 8 | 8 |
| Tree | 10 | 9 | 9 | 9 |
| Adaboost | 11 | 10 | 10 | 10 |
| SVM (polynomial) | 1 | 11 | 11 | 11 |
| CN2 rule inducer | 12 | 12 | 12 | 12 |
Analysis of Methodological Consensus and Divergence
The results reveal a remarkable consensus among three of the four methods (TOPSIS, VIKOR, and Fuzzy TOPSIS) regarding both the best-performing and worst-performing models, providing strong, cross-validated evidence for the most and least reliable diagnostic options. For the top-tier consensus, the Neural Network, SVM (linear), Naive Bayes, and RBF are consistently ranked in the top four positions, with the Neural Network's repeated first-place finish across three methodologically distinct approaches confirming its superior ability to handle complex diagnostic patterns while maintaining an exceptional balance across all performance metrics. Conversely, a bottom-tier consensus unanimously identifies the CN2 rule inducer as the least suitable model, primarily due to its critically poor performance on computational time (7.57s) and unsatisfactory diagnostic metrics like FPR (29.4) and FNR (27.6), while the consistent low ranking of SVM (polynomial) by the same three methods further validates the framework's effectiveness in flagging models with severe, disqualifying weaknesses.
Critical Methodological Divergence: The Case of SVM (Polynomial) presents the most striking discrepancy in this analysis, with CODAS ranking it as the top model (1st) while the other three methods consistently place it near the bottom (11th). This stark contrast stems from fundamental differences in methodological logic: CODAS's hybrid distance measurement, combining Euclidean and Taxicab distances, disproportionately rewards SVM (Polynomial)'s exceptional performance on specific criteria like TPR (94.7%) and AUC (0.975), potentially masking its critical weaknesses through its unique judgment function. In contrast, TOPSIS, VIKOR, and Fuzzy TOPSIS prioritize balanced performance across all criteria and heavily penalize catastrophic failures, specifically the model's dangerously high False Negative Rate (FNR of 44.3%) —an unacceptable risk in medical diagnostics where missing infected patients constitutes a critical failure. This divergence serves as a crucial cautionary note, demonstrating that excellence in select metrics cannot compensate for severe deficiencies in critical areas, while simultaneously validating the superior reliability of methods that enforce balanced performance standards for high-stakes healthcare applications.
Mid-Rank Stability and Minor Variations demonstrate remarkable consistency in the evaluation of mid-tier models, with positions 5 through 10 showing high stability across TOPSIS, VIKOR, and Fuzzy TOPSIS methods, confirming the reliability of rankings for models like SGD, KNN, Logistic Regression, Random Forest, Tree, and Adaboost. The only notable variation appears between CODAS and the other methods regarding the order of KNN and SGD, a minor swap attributable to CODAS's unique distance aggregation approach that combines Euclidean and Taxicab measures, though this discrepancy does not alter the fundamental performance tier grouping. This overall consistency across three distinct methodological frameworks reinforces the validity of the mid-tier rankings and suggests that while the exact ordinal positions might show slight variations, the collective assessment of these models' comparative performance remains robust and methodologically sound.
Validation through Fuzzy TOPSIS
The application of Fuzzy TOPSIS, which explicitly incorporates uncertainty into the performance data, produced a ranking identical to the standard TOPSIS method, thereby demonstrating two critical strengths: first, it confirms the robustness of the rankings against minor data perturbations or imprecision, and second, it provides methodological reinforcement by showing that the results remain stable even when real-world vagueness is formally modeled. This consistency, combined with the perfect agreement among TOPSIS, VIKOR, and Fuzzy TOPSIS, establishes a highly reliable consensus that definitively identifies the Neural Network and SVM-Linear as the top-performing models due to their balanced and superior performance across all diagnostic dimensions. Conversely, the significant outlier result from CODAS—which ranked SVM (Polynomial) first—underscores that methodology critically matters, especially in medical diagnostics where avoiding catastrophic failures in any single criterion is paramount; thus, while mathematically valid within its own framework, relying solely on CODAS could yield high-risk recommendations, affirming the necessity of a multi-method approach for robust, high-stakes decision-making.
Sensitivity Analysis Results
This section presents the findings of the sensitivity analysis conducted to evaluate the robustness of the MCDM rankings against changes in the importance weights of the evaluation criteria. The stability of the results under varying decision-making scenarios is crucial for validating the final recommendation.
Presentation of Ranking Stability
To comprehensively evaluate the robustness of our model rankings against potential variations in decision priorities, we conducted a systematic sensitivity analysis by manipulating the weighting schemes of key evaluation criteria. This investigation methodically altered the relative importance of three crucial dimensions: diagnostic Accuracy (representing overall correctness), Recall (reflecting sensitivity in detecting infected patients, a critical metric for disease control), and operational Time (indicating computational efficiency and speed of diagnosis). For each scenario, we elevated the weight of the target criterion to a dominant value of 0.5 (50% importance) while proportionally reducing the weights of the remaining nine criteria to maintain the necessary sum of 1.0, thereby creating extreme but plausible priority configurations that stress-test the stability of our initial rankings. The results of these sensitivity tests, consistently applied using the TOPSIS method to ensure comparability, are systematically consolidated in Table 13, which reveals the remarkable stability of our primary recommendations even under these significantly altered preference structures.
Table 5: Sensitivity Analysis - Ranking Stability under Different Weighting Scenarios using TOPSIS
| Model | Base Scenario (All wᵢ = 0.1) | High Accuracy (w = 0.5) | High Recall (w = 0.5) | High Speed/Low Time (w = 0.5) |
| Neural Network | 1 | 1 | 1 | 1 |
| SVM (linear) | 2 | 2 | 2 | 2 |
| Naive Bayes | 3 | 3 | 4 | 4 |
| RBF | 4 | 4 | 3 | 3 |
| SGD | 5 | 5 | 5 | 5 |
| KNN | 6 | 6 | 6 | 6 |
| Logistic Regression | 7 | 7 | 7 | 7 |
| Random Forest | 8 | 8 | 8 | 8 |
| Tree | 9 | 9 | 9 | 9 |
| Adaboost | 10 | 10 | 10 | 10 |
| SVM (polynomial) | 11 | 11 | 11 | 11 |
| CN2 rule inducer | 12 | 12 | 12 | 12 |

Figure 2: Sensitivity Analysis of Top 4 Models' Ranks to Weight Changes
Scenario Accuracy Recall Speed
The sensitivity analysis reveals a clear hierarchy in model robustness, with the Neural Network and SVM (linear) demonstrating exceptional stability as their ranking bars remain perfectly constant at positions 1 and 2, respectively, across all tested weighting scenarios Base, High Accuracy, High Recall, and High Speed—indicating that their superior performance is inherent and not dependent on any specific priority-zation of criteria. In contrast, the bars for Naive Bayes and RBF exhibit a minor but logical swap between ranks 3 and 4, specifically in the "High Recall" and "High Speed" scenarios : when sensitivity is prioritized, RBF's stronger recall performance (0.96) gives it a slight edge over Naive Bayes (0.976), while when processing speed becomes critical, Naive Bayes' faster computation time (0.14s) pushes it ahead of RBF (0.16s). This predictable variation confirms that the performance characteristics of these mid-tier models are well-aligned with their sensitivity res-ponses, yet these minor positional changes do not challenge the unequivocal dominance and stability of the top two models, reinforcing the reliability of the primary recommendations for clinical implement-tation.
Discussion of the Robustness of the Top Models
The sensitivity analysis yields a clear and significant conclusion regarding the stability of the model rankings. Exceptional Stability of the Top Two Models represents the most robust finding of this study, as both the Neural Network and SVM (linear) models maintain their 1st and 2nd positions unconditionally across all tested weighting scenarios, including extreme cases where a single criterion such as Accuracy, Recall, or Time was assigned a dominant weight of 50%. This unwavering stability decisively indicates that the superiority of these models is not an artifact of any specific weight assignment or decision-maker priority, but rather a direct consequence of their inherently balanced and superior performance profiles across the entire spectrum of evaluation criteria. Consequently, regardless of whether a healthcare institution prioritizes ultimate diagnostic precision, the critical need to minimize false negatives, or maximum operational throughput, the Neural Network and SVM (linear) consistently emerge as the optimal choices, providing exceptional reliability for clinical implementation.
The exceptional robustness of the top two models is fundamentally attributable to their comprehensively superior performance profiles as evidenced in the original decision matrix, where the Neural Network demonstrates top-tier excellence across nearly all benefit criteria including exceptional AUC (0.988), Accuracy (0.987), F-Score (0.988), and Recall (0.990) while concurrently maintaining a very low false positive rate (2.6) and a reasonable computation time (0.55s), exhibiting no critical weaknesses. Similarly, SVM (linear) displays a powerfully balanced profile with outstanding AUC (0.988) and Accuracy (0.983) complemented by an excellent computation time (0.19s), rendering it both highly accurate and operationally efficient. This consiste excellence across the entire criterion spectrum ensures that regardless of which specific metric is heavily weighted—be it accuracy, sensitivity, or speed—one of these two models consistently ranks at or near the top for that particular criterion, thereby preventing any competing model from accumulating enough advantage to surpass them in the overall aggregated ranking.
Managed Sensitivity in the Upper-Mid Tier reveals that the only rank changes observed throughout the sensitivity analysis were logical and minor positional swaps between Naive Bayes and RBF for the 3rd and 4th positions, demonstrating a predictable and interpretable pattern: when Recall was prioritized, RBF's superior sensitivity performance (Recall: 0.96) provided a slight advantage over Naive Bayes (Recall: 0.976), whereas when Time became the dominant criterion, Naive Bayes' faster computation speed (0.14s) allowed it to regain a marginal lead over RBF (0.16s). This intuitive and consistent behavior not only validates that the TOPSIS model is correctly responding to the decision-maker's stated preferences but also confirms that the relative performance of these two models is exceptionally close, indicating that the final selection between them for clinical implementation could legitimately depend on specific institutional priorities and operational contexts without compromising diagnostic quality.
Conclusion of the Sensitivity Analysis: The comprehensive sensitivity analysis conclusively demonstrates that the core recommendation of this study is highly robust, as the identification of Neural Network and SVM (linear) as the top two models remains stable and reliable, completely unaffected by significant uncertainties or strategic shifts in the relative importance of key decision criteria. This crucial finding empowers healthcare decision-makers to select either of these models with a high degree of confidence, secure in the knowledge that their choice will consistently deliver optimal performance across a wide spectrum of potential operational priorities and clinical scenarios, from accuracy-focused diagnostic settings to time-critical screening environments.
The Adopted Decision-Making Protocol
The selection of optimal artificial intelligence models for high-stakes healthcare applications requires a methodical and validated approach. This study establishes and demonstrates a rigorous tripartite protocol that systematically transitions from initial analysis to a validated implementation-ready recommendation. The workflow begins with Phase 1: Primary Ranking using TOPSIS, which leverages an intuitive geometric "closeness to ideal" logic to generate an initial hierarchy of alternatives; in our case, this identified the Neural Network as the top-performing model for COVID-19 diagnosis. This initial result is then subjected to Phase 2: Validation through VIKOR Consensus Check, a critical step where the ranking is cross-verified using a method with a fundamentally different philosophical basis focused on compromise solutions. The perfect agreement between TOPSIS and VIKOR on the top two models Neural Network and SVM (Linear) elevated confidence in the result from a preliminary finding to a high-consensus outcome. Finally, Phase 3: Robustness Assurance via Sensitivity Analysis tests the stability of this consensus under realistic shifts in strategic priorities, such as heavily weighting diagnostic accuracy, sensitivity (Recall), or computational speed. The unconditional stability of the top two models across all tested scenarios confirmed the recommendation's robustness. This structured, three-phase protocol effectively mitigates the inherent limitations of single-method analyses and provides a transparent, defensible pathway from raw performance data to a final, actionable decision for healthcare institutions.
This protocol consists of three integrated phases, each serving a distinct validation purpose.
Phase 1: Primary Ranking with TOPSIS establishes the foundational baseline for model evaluation by calculating each alternative's geometric proximity to an ideal solution. This method is strategically chosen as the primary ranking tool due to its three distinct advantages: its intuitive concept of selecting alternatives nearest to the positive ideal and farthest from the negative ideal resonates clearly with diverse stakeholders including clinicians, administrators, and technical staff; its computational simplicity enables straightforward implementation and transparent calculation processes; and its crucial emphasis on balanced performance inherently penalizes models with severe weaknesses in any single criterion through its distance-based measurement system, a critical safeguard for patient safety in healthcare applications. The phase culminates in the calculation of relative closeness coefficients (Cᵢ) for all alternatives, generating the initial hierarchical ranking that identifies the Neural Network as the foremost candidate while immediately flagging models like SVM (Polynomial) despite its strong performance on certain metrics due to its critical failure in false negative rate.
Phase 2: Validation through VIKOR Consensus Check serves as the critical verification step, testing the initial TOPSIS ranking against a method with a fundamentally different philosophical foundation centered on achieving a balanced compromise. VIKOR complements TOPSIS by explicitly quantifying two key dimensions: Group Utility (S), which measures the aggregate benefit for the majority, and Individual Regret (R), which captures the maximum dissatisfaction for any single criterion, thereby ensuring that a solution acceptable to all stakeholders is identified. The phase proceeds by calculating the VIKOR indices (Sᵢ, Rᵢ, Qᵢ) for each alternative and then comparing the top-ranked models from the resulting VIKOR (Qᵢ) list with the TOPSIS ranking. The decision rule is pivotal : à High-Confidence Outcome is declared if the top alternatives are identical, signaling a robust consensus and allowing the process to proceed ; however, à Low-Consensus Outcome triggers an essential investi-gation into the methodological discrepancies, requiring a deeper analysis of the S and R values to understand the underlying trade-offs before any final recommendation can be considered, thus ensuring the validity and acceptability of the result.
Phase 3: Robustness Assurance via Sensitivity Analysis addresses the inherent subjectivity in criterion weight-ing by systematically testing whether the consensus ranking from previous phases remains stable under shifting priorities, thereby distinguishing truly robust recommendations from those that are merely artifacts of a specific weight configuration. This process involves identifying pivotal criteria representing fundamental trade-offs—such as Accuracy versus Speed or Sensitivity versus Cost—and then methodically inflating the weight of each to a dominant value while proportionally adjusting others, followed by recalculating the TOPSIS rankings for each scenario to monitor fluctuations in the top alternatives. The decisive outcome follows a clear rule: if the leading models demonstrate unwavering positions across all tested conditions, the result is certified as a Stable Recommen-dation worthy of implementation; however, if the hierarchy shifts with changing weights, the conclusion transitions to a Context-Dependent Recommendation, explicitly guiding stakeholders toward different optimal choices based on their specific operational priorities, such as prioritizing clinical accuracy versus operational speed.

Figure 3: Flowchart of the Tripartite Protocol
The standardized tripartite protocol developed for COVID-19 model selection demonstrates significant generalizability and can be effectively applied to a wide spectrum of healthcare technology assessment challenges, including medical device selection such as choosing between advanced imaging systems or surgical robots, treatment pathway analysis that evaluates competing protocols based on efficacy, cost, and patient quality of life, healthcare software procurement for systems like Electronic Health Records or telemedicine platforms, and strategic resource allocation for prioritizing public health interventions or new hospital services. By systematically employing this structured methodology utilizing TOPSIS for primary ranking, VIKOR for consensus validation, and sensitivity analysis for robustness assurance healthcare organizations, researchers, and policymakers can transform complex, multi-faceted decisions into a transparent, rigorously validated, and defensible process, thereby consistently achieving more reliable and justifiable outcomes across diverse healthcare contexts.
The Application of the Tripartite Protocol to COVID-19 Model Benchmarking was systematically executed with the primary objective of identifying the most robust and reliable diagnostic model through a rigorously validated multi-stage process. This began with Phase 1: Primary Ranking using TOPSIS, which calculated the geometric proximity of each model to an ideal solution and initially identified the Neural Network as the top performer. The results were then subjected to Phase 2: Validation through VIKOR Consensus Check, where the perfect agreement between VIKOR and TOPSIS on the top two models—Neural Network and SVM (Linear)—elevated the finding to a high-confidence consensus. Finally, Phase 3: Robustness Assurance via Sensitivity Analysis confirmed the unconditional stability of these top models under extreme shifts in criterion priorities, conclusively demonstrating that the final recommendation remains optimal whether a healthcare institution prioritizes diagnostic accuracy, sensitivity, or operational speed, thereby delivering a definitively robust and implementation-ready solution.
Phase 1: Calculate Rankings using TOPSIS was systematically executed by applying the TOPSIS methodology to the comprehensive decision matrix (Table 1), which integrated performance data for twelve distinct COVID-19 diagnostic models evaluated against ten critical clinical and operational criteria. This analytical process computed the relative Closeness Coefficient (Cᵢ) for each model, measuring its Euclidean distance from both the positive and negative ideal solutions, thereby generating a definitive performance hierarchy. The resulting ranking established the Neural Network as the foremost model with the highest Cᵢ score (0.848), followed by SVM (Linear) (0.772), Naive Bayes (0.697), and RBF (0.642), while simultaneously identifying SVM (Polynomial) as a critically flawed alternative due to its substantially lower score (0.233), thereby providing a mathematically robust baseline for subsequent validation phases.
Table 6: Rankings using TOPSIS
| Rank | Model | TOPSIS Score (Cᵢ) |
| 1 | Neural Network | 0.848 |
| 2 | SVM (Linear) | 0.772 |
| 3 | Naive Bayes | 0.697 |
| 4 | RBF | 0.642 |
| ... | ... | ... |
| 11 | SVM (Polynomial) | 0.233 |
The provided table presents the final ranking of COVID-19 diagnostic models generated by the TOPSIS method, a core component of the tripartite protocol. It reveals a clear performance hierarchy, with the Neural Network model decisively occupying the top position, as indicated by its highest Closeness Coefficient (Cᵢ = 0.848). This score, which measures the geometric proximity to an ideal solution, confirms its superior and most balanced performance across all ten evaluation criteria. The SVM (Linear) model solidly holds the second rank (Cᵢ = 0.772), establishing itself as a strong and reliable alternative. A significant performance gap is evident after the fourth-ranked model (RBF, Cᵢ = 0.642), with the SVM (Polynomial) model being critically positioned near the bottom (11th rank, Cᵢ = 0.233), a result that flags it as a high-risk option due to its substantial distance from the ideal performance profile. This outcome from Phase 1 provides the foundational, quantitative evidence for the initial model selection.
Phase 2: Validate with VIKOR Consensus Check involved applying the VIKOR method to the identical decision matrix used in Phase 1, systematically calculating the compromise solution index (Qᵢ) for each model to evaluate their performance based on the balance between group utility and individual regret. The resulting ranking provided a critical validation point, generating a hierarchy that confirmed the Neural Network as the optimal compromise solution with a perfect Qᵢ score of 0.000, followed by SVM (Linear) at 0.073, while simultaneously reinforcing the poor performance of SVM (Polynomial) with a substantially higher Qᵢ value of 0.866, thereby creating an essential methodological cross-verification of the initial TOPSIS results.
Table 7: Ranking using VIKOR
| Rank | Model | VIKOR Score (Qᵢ) |
| 1 | Neural Network | 0.000 |
| 2 | SVM (Linear) | 0.073 |
| 3 | Naive Bayes | 0.154 |
| 4 | RBF | 0.213 |
| ... | ... | ... |
| 11 | SVM (Polynomial) | 0.866 |
The Consensus Check between the two methodological approaches revealed perfect alignment, as both TOPSIS Top 2 (Neural Network, SVM (Linear)) and VIKOR Top 2 (Neural Network, SVM (Linear)) were identical. According to the predefined Decision Rule, this exact match in the top-ranked alternatives signifies a high-confidence outcome. Consequently, the Outcome is a definitive HIGH CONSENSUS, successfully validating the initial TOPSIS ranking and authorizing the progression to Phase 3 for the final robustness assurance.
Phase 3: Confirm Stability with Sensitivity Analysis involved a rigorous examination of the ranking's robustness by systematically increasing the weights of three key criteria Accuracy, Recall, and Time to a dominant level of 0.5 each, while proportionally adjusting the weights of the remaining criteria, and re-executing the TOPSIS analysis for each of these extreme preference scenarios. The results demonstrated exceptional stability, as the ranking of the top models remained unchanged under these stringent conditions, with the Neural Network and SVM (Linear) consistently maintaining their first and second positions regardless of which criterion was heavily prioritized.
Table 8: Sensitivity Analysis
| Model | Base Scenario | High Accuracy | High Recall | High Speed |
| Neural Network | 1 | 1 | 1 | 1 |
| SVM (Linear) | 2 | 2 | 2 | 2 |
| Naive Bayes | 3 | 3 | 4 | 4 |
| RBF | 4 | 4 | 3 | 3 |
The Stability Check conclusively demonstrated that the identities and ordinal positions of the top two models Neural Network and SVM (Linear) remained completely unchanged across all sensitivity analysis scenarios, including the extreme weighting of Accuracy, Recall, and Time. This unwavering consistency under significant shifts in criterion importance confirms the exceptional robustness of the initial ranking, leading to the definitive Outcome: STABLE RESULT, which certifies that the core recommendation is reliable for implementation across diverse healthcare settings and strategic priorities.
The final verdict from the protocol confirms the successful and rigorous execution of the tripartite methodology, which systematically progressed through three critical validation stages: Phase 1 definitively identified the Neural Network as the primary candidate through TOPSIS analysis, calculating its superior geometric proximity to the ideal solution; Phase 2 achieved High Consensus as VIKOR's compromise solution index corroborated the exact top-ranking models, demonstrating methodological convergence from a different theoretical foundation; and Phase 3 yielded a Stable Result through comprehensive sensitivity analysis, confirming the ranking's unwavering robustness against extreme weighting scenarios for Accuracy, Recall, and Time. This exhaustive multi-method validation process, which cross-examined results using distance-based, compromise-focused, and uncertainty-integrated approaches, culminates in the conclusive and defensible recommendation that the Neural Network model stands as the optimal choice for COVID-19 diagnosis, with the SVM (Linear) model serving as a computationally efficient and highly reliable alternative, thereby providing healthcare institutions with an evidence-based framework for clinical implementation that balances diagnostic excellence with operational practicality across diverse medical settings.
Conclusion
This study addressed the critical challenge of selecting optimal COVID-19 diagnostic models from numerous competing alternatives characterized by multiple, often conflicting performance criteria. Through the development and application of a novel tripartite MCDM framework integrating CODAS, TOPSIS, VIKOR, and Fuzzy TOPSIS methods, we established a rigorous benchmarking methodology that transcends conventional single-method approaches. Our comprehensive analysis of twelve machine learning models across ten evaluation criteria consistently identified the Neural Network as the superior model, with SVM (Linear) as a strong alternative, while simultaneously revealing the critical importance of methodological choice through the divergent CODAS result for SVM (Polynomial). The demonstrated robustness of these findings through extensive sensitivity analysis provides healthcare institutions with reliable, evidence-based guidance for clinical implementation.
This research makes significant contributions to both healthcare informatics and decision sciences by introducing a validated multi-method MCDM framework that effectively mitigates the limitations of single-method approaches. The demonstrated protocol—TOPSIS for primary ranking, VIKOR for consensus validation, and sensitivity analysis for robustness assurance—represents a methodological advancement that ensures more reliable and defensible decision outcomes. Furthermore, our study provides the most comprehensive benchmarking of COVID-19 diagnostic models to date, establishing a new standard for objective AI model evaluation in medical applications that balances clinical accuracy with operational practicality.
While this study provides robust findings, several limitations should be acknowledged. The analysis relied on a specific dataset and performance metrics that, while comprehensive, may not capture all relevant clinical considerations. The selected criteria, though carefully chosen, could be expanded to include factors such as model interpretability, implementation costs, and generalization across diverse patient populations. Additionally, the equal weighting scheme adopted for most analyses, though validated through sensitivity testing, may not reflect the precise priorities of all healthcare institutions. The study also focused on a specific set of MCDM methods, leaving room for exploration of additional decision-making techniques.
This research establishes a foundation for more rigorous, transparent, and reliable evaluation of medical AI systems, ultimately contributing to improved healthcare decision-making and patient outcomes through scientifically validated technology adoption.
References
- Abd Ghani, M. K., Mohammed, M. A., Arunkumar, N., Mostafa, S. A., Ibrahim, D. A., Abdullah, et al., (2020). Decision-level fusion scheme for nasopharyngeal carcinoma identification using machine learning techniques. Neural Computing and Applications, 32(3) :625–638.
Publisher | Google Scholor - Ai, T., Yang, Z., Hou, H., Zhan, C., Chen, C., Lv, W., Tao, Q., Sun, Z., & Xia, L. (2020). Correlation of chest CT and RT-PCR testing in coronavirus disease 2019 (COVID-19) in China : A report of 1014 cases. Radiology, 200642.
Publisher | Google Scholor - Al-Safwani, N., Hassan, S., & Katuk, N. (2014). On multi attribute decision making methods : Prioritizing information security controls. Journal of Applied Sciences, 14(16) :1865–1870.
Publisher | Google Scholor - Baltussen, R., & Niessen, L. (2006). Priority setting of health interventions : The need for multi-criteria decision analysis. Cost Effectiveness and Resource Allocation, 4(1):14.
Publisher | Google Scholor - Chen, J., Wu, L., Zhang, J., Zhang, L., Gong, D., et al. (2020). Deep learning-based model for detecting 2019 novel coronavirus pneumonia on high-resolution computed tomography : A prospective study. MedRxiv.
Publisher | Google Scholor - Cheng, J., et al. (2020). A Reliable Context Model for Context-aware Applications.
Publisher | Google Scholor - Criminisi, A. (2016). Machine learning for medical images analysis. Medical Image Analysis, 33:91–93.
Publisher | Google Scholor - Gozes, O., Frid-Adar, M., Greenspan, H., Browning, P. D., Zhang, H., Ji, W., Bernheim, A., & Siegel, E. (2020). Rapid AI development cycle for the coronavirus (COVID-19) pandemic : Initial results for automated detection and patient monitoring using deep learning CT image analysis. ArXiv preprint arXiv :2003.05037.
Publisher | Google Scholor - Huang, C., Wang, Y., Li, X., Ren, L., Zhao, J., Hu, Y., Zhang, L., Fan, G., Xu, J., Gu, X., & Cheng, Z. (2020). Clinical features of patients infected with 2019 novel coronavirus in Wuhan, China. The Lancet, 395(10223) :497–506.
Publisher | Google Scholor - Jadhav, A., & Sonar, R. (2009). Analytic hierarchy process (AHP) : weighted scoring method (WSM):and hybrid knowledge-based system (HKBS) for software selection: A comparative study. In Proceedings of the 2nd International Conference on Emerging Trends in Engineering and Technology, 991–997.
Publisher | Google Scholor - Klein, S., Pluim, J. P., Staring, M., & Viergever, M. A. (2009). Adaptive stochastic gradient descent optimisation for image registration. International Journal of Computer Vision, 81(3):227–239.
Publisher | Google Scholor - Li, L., Qin, L., Xu, Z., Yin, Y., Wang, X., et al., (2020). Artificial intelligence distinguishes COVID-19 from community-acquired pneumonia on chest CT. Radiology, 200905.
Publisher | Google Scholor - Marsh, K., IJzerman, M., Thokala, P., Baltussen, R., Boysen, M., Kaló, Z., Lönngren, T., Mussen, F., Peacock, S., Watkins, J., & Devlin, N. (2016). Multiple criteria decision analysis for health care decision making : Emerging good practices. Value in Health, 19(2):125–137.
Publisher | Google Scholor - Mohammed, M. A., Al-Khateeb, B., Rashid, A. N., Ibrahim, D. A., Abd Ghani, M. K., & Mostafa, S. A. (2018). Neural network and multifractal dimension features for breast cancer classification from ultrasound images. Computers & Electrical Engineering, 70:871–882.
Publisher | Google Scholor - Mohammed, M. A., Abd Ghani, M. K., Arunkumar, N., Hamed, R. I., Abdullah, M. K., & Burhanuddin, M. A. (2018). A real-time computer-aided object detection of nasopharyngeal carcinoma using genetic algorithm and artificial neural network based on Haar features. Future Generation Computer Systems, 89:539–547.
Publisher | Google Scholor - Mostafa, S. A., Mustapha, A., Khaleefah, S. H., Ahmad, M. S., & Mohammed, M. A. (2018). Evaluating the performance of three classification methods in diagnosis of Parkinson’s disease. In Proceedings of the International Conference on Soft Computing and Data Mining. Springer, 43-52.
Publisher | Google Scholor - Ng, M.-Y., Lee, E. Y., Yang, J., Yang, F., Li, X., et al. (2020). Imaging profile of the COVID-19 infection : Radiologic findings and literature review. Radiology : Cardiothoracic Imaging, 2(1):e200034.
Publisher | Google Scholor - Obaid, O. I., Mohammed, M. A., Abd Ghani, M. K., Mostafa, A., & Taha, F. (2018). Evaluating the performance of machine learning techniques in the classification of Wisconsin breast cancer. International Journal of Engineering and Technology, 7(4):160–166.
Publisher | Google Scholor - Oliveira, M., Fontes, D., & Pereira, T. (2014). Multicriteria decision-making : A case study in the automobile industry. Annals of Management Science, 3(1):109–128.
Publisher | Google Scholor - Petrovic-Lazarevic, S., & Abraham, A. (2004). Hybrid fuzzy-linear programming approach for multicriteria decision-making problems. ArXiv preprint arXiv :cs/0405019.
Publisher | Google Scholor - Vapnik, V. (1999). The nature of statistical learning theory. Springer.
Publisher | Google Scholor - Villarejo, M., Zapirain, B., & Zorrilla, A. (2013). Algorithms based on CWT and classifiers to control cardiac alterations and stress using an ECG and a SCR. Sensors, 13(5):6141–6170.
Publisher | Google Scholor - Wang, L., & Wong, A. (2020). COVID-Net : A tailored deep convolutional neural network design for detection of COVID-19 cases from chest X-ray images. ArXiv preprint arXiv:2003.09871.
Publisher | Google Scholor - Wang, W., Xu, Y., Gao, R., Lu, R., Han, K., Wu, G., & Tan, W. (2020). Detection of SARS-CoV-2 in different types of clinical specimens. JAMA, 323(18):1843–1844.
Publisher | Google Scholor - Wu, Y., Xu, C., & Zhang, T. (2018). Evaluation of renewable power sources using a fuzzy MCDM based on cumulative prospect theory : A case in China. Energy, 147:1227–1239.
Publisher | Google Scholor - Xu, C., Wu, Y., & Dai, S. (2020). Critical barriers to the development of hydrogen refueling stations in China : A modified fuzzy DEMATEL approach. Energy Policy, 142, 111495.
Publisher | Google Scholor - Xu, X., Jiang, X., Ma, C., Du, P., Li, X., et al. (2020). Deep learning system to screen coronavirus disease 2019 pneumonia. ArXiv preprint arXiv:2002.09334.
Publisher | Google Scholor - Yan, L., Zhang, H. T., Xiao, Y., Wang, M., Sun, C., et al. (2020). Prediction of criticality in patients with severe COVID-19 infection using machine learning-based prognostic model. medRxiv.
Publisher | Google Scholor - Yas, Q. M., Zaidan, A. A., Zaidan, B. B., Rahmatullah, B., & Karim, H. A. (2018). Comprehensive insights into evaluation and benchmarking of real-time skin detectors. Measurement, 114:243–260.
Publisher | Google Scholor - Zaidan, A. A., Karim, H. A., Ahmad, N. N., Zaidan, B. B., & Kiah, M. L. M. (2015). Robust pornography classification solving the image size variation problem based on multi-agent learning. Journal of Circuits, Systems and Computers, 24(2):1550023.
Publisher | Google Scholor - Zhang, Y., Kwon, D., & Pohl, K. M. (2017). Computing group cardinality constraint solutions for logistic regression problems. Medical Image Analysis, 35:58–69.
Publisher | Google Scholor - Zheng, C., et al. (2020). A method for evaluating context-based citation recommendation systems.
Publisher | Google Scholor - Zionts, S. (1979). MCDM—If not a Roman numeral, then what ? Interfaces, 9(4):94–101.
Publisher | Google Scholor